Pakistani vs Immigrants from Thailand Single Mother Households
COMPARE
Pakistani
Immigrants from Thailand
Single Mother Households
Single Mother Households Comparison
Pakistanis
Immigrants from Thailand
6.1%
SINGLE MOTHER HOUSEHOLDS
79.2/ 100
METRIC RATING
152nd/ 347
METRIC RANK
6.9%
SINGLE MOTHER HOUSEHOLDS
4.0/ 100
METRIC RATING
220th/ 347
METRIC RANK
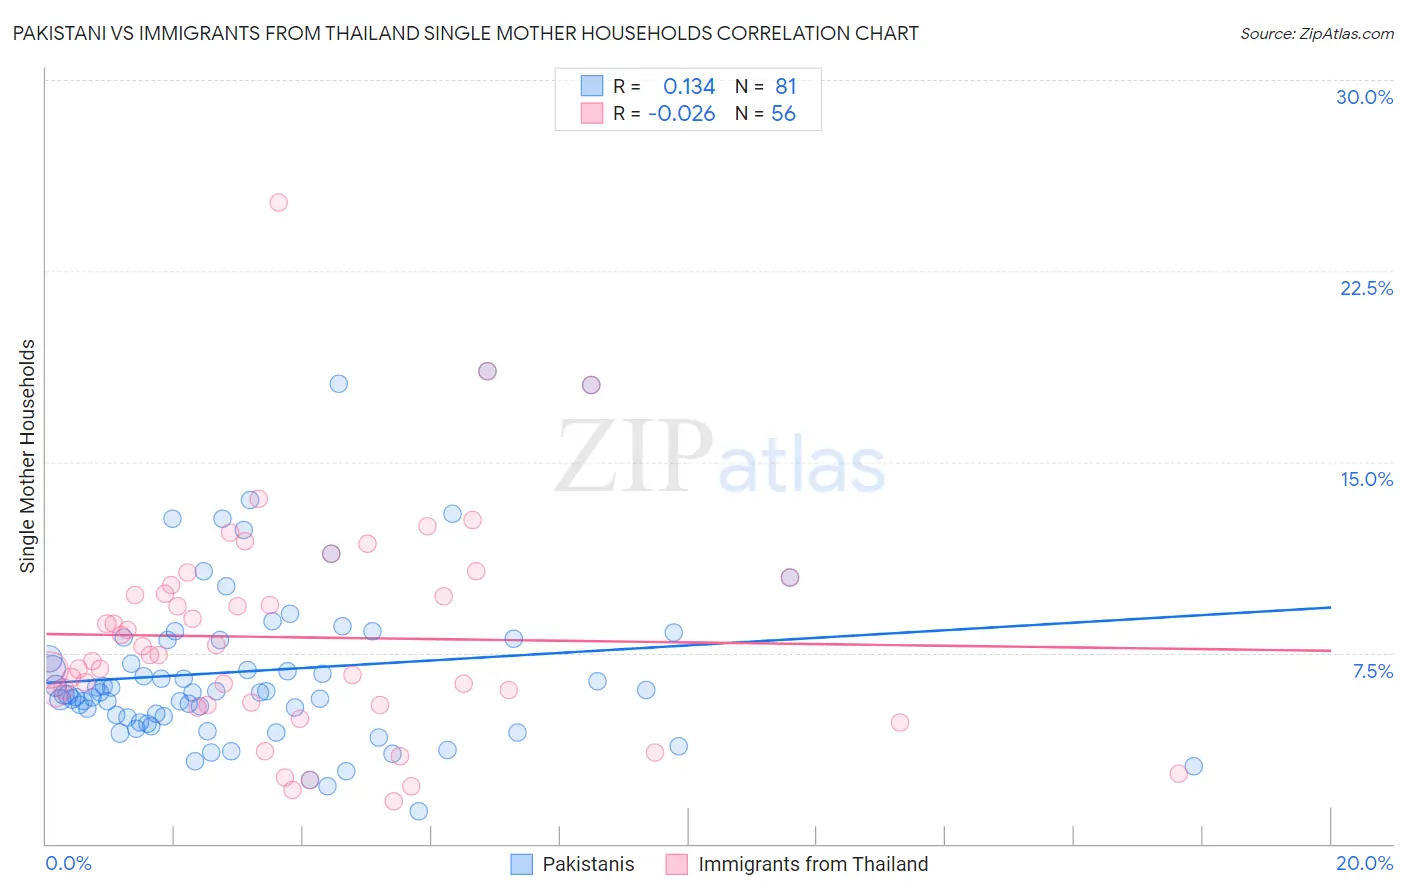
Pakistani vs Immigrants from Thailand Single Mother Households Correlation Chart
The statistical analysis conducted on geographies consisting of 334,696,981 people shows a poor positive correlation between the proportion of Pakistanis and percentage of single mother households in the United States with a correlation coefficient (R) of 0.134 and weighted average of 6.1%. Similarly, the statistical analysis conducted on geographies consisting of 316,498,474 people shows no correlation between the proportion of Immigrants from Thailand and percentage of single mother households in the United States with a correlation coefficient (R) of -0.026 and weighted average of 6.9%, a difference of 12.8%.
Single Mother Households Correlation Summary
| Measurement | Pakistani | Immigrants from Thailand |
| Minimum | 1.3% | 1.7% |
| Maximum | 18.6% | 25.2% |
| Range | 17.3% | 23.6% |
| Mean | 6.8% | 8.1% |
| Median | 6.0% | 7.4% |
| Interquartile 25% (IQ1) | 4.9% | 5.5% |
| Interquartile 75% (IQ3) | 8.0% | 10.0% |
| Interquartile Range (IQR) | 3.2% | 4.5% |
| Standard Deviation (Sample) | 3.4% | 4.3% |
| Standard Deviation (Population) | 3.4% | 4.2% |
Similar Demographics by Single Mother Households
Demographics Similar to Pakistanis by Single Mother Households
In terms of single mother households, the demographic groups most similar to Pakistanis are Immigrants from Brazil (6.1%, a difference of 0.040%), Immigrants from Philippines (6.1%, a difference of 0.11%), Immigrants from Southern Europe (6.1%, a difference of 0.23%), Zimbabwean (6.1%, a difference of 0.28%), and Immigrants from Albania (6.1%, a difference of 0.42%).
| Demographics | Rating | Rank | Single Mother Households |
| Arabs | 84.0 /100 | #145 | Excellent 6.0% |
| French Canadians | 82.6 /100 | #146 | Excellent 6.0% |
| Immigrants | Jordan | 82.3 /100 | #147 | Excellent 6.0% |
| Scotch-Irish | 82.0 /100 | #148 | Excellent 6.0% |
| Immigrants | Albania | 81.5 /100 | #149 | Excellent 6.1% |
| Zimbabweans | 80.7 /100 | #150 | Excellent 6.1% |
| Immigrants | Southern Europe | 80.5 /100 | #151 | Excellent 6.1% |
| Pakistanis | 79.2 /100 | #152 | Good 6.1% |
| Immigrants | Brazil | 78.9 /100 | #153 | Good 6.1% |
| Immigrants | Philippines | 78.5 /100 | #154 | Good 6.1% |
| Whites/Caucasians | 76.5 /100 | #155 | Good 6.1% |
| Native Hawaiians | 75.0 /100 | #156 | Good 6.1% |
| Chileans | 74.2 /100 | #157 | Good 6.1% |
| Celtics | 73.3 /100 | #158 | Good 6.1% |
| Yugoslavians | 73.1 /100 | #159 | Good 6.1% |
Demographics Similar to Immigrants from Thailand by Single Mother Households
In terms of single mother households, the demographic groups most similar to Immigrants from Thailand are Immigrants (6.8%, a difference of 0.18%), French American Indian (6.9%, a difference of 0.19%), Immigrants from Bangladesh (6.9%, a difference of 0.22%), Immigrants from Micronesia (6.9%, a difference of 0.26%), and Immigrants from Eastern Africa (6.8%, a difference of 0.27%).
| Demographics | Rating | Rank | Single Mother Households |
| Immigrants | Costa Rica | 8.2 /100 | #213 | Tragic 6.7% |
| Immigrants | Uruguay | 7.9 /100 | #214 | Tragic 6.7% |
| Shoshone | 5.7 /100 | #215 | Tragic 6.8% |
| Cherokee | 5.1 /100 | #216 | Tragic 6.8% |
| Aleuts | 4.8 /100 | #217 | Tragic 6.8% |
| Immigrants | Eastern Africa | 4.4 /100 | #218 | Tragic 6.8% |
| Immigrants | Immigrants | 4.3 /100 | #219 | Tragic 6.8% |
| Immigrants | Thailand | 4.0 /100 | #220 | Tragic 6.9% |
| French American Indians | 3.7 /100 | #221 | Tragic 6.9% |
| Immigrants | Bangladesh | 3.7 /100 | #222 | Tragic 6.9% |
| Immigrants | Micronesia | 3.6 /100 | #223 | Tragic 6.9% |
| Immigrants | Sudan | 3.5 /100 | #224 | Tragic 6.9% |
| Sudanese | 3.1 /100 | #225 | Tragic 6.9% |
| Paiute | 2.4 /100 | #226 | Tragic 7.0% |
| Kenyans | 2.3 /100 | #227 | Tragic 7.0% |