Maltese vs Venezuelan Single Mother Households
COMPARE
Maltese
Venezuelan
Single Mother Households
Single Mother Households Comparison
Maltese
Venezuelans
5.2%
SINGLE MOTHER HOUSEHOLDS
99.9/ 100
METRIC RATING
20th/ 347
METRIC RANK
6.6%
SINGLE MOTHER HOUSEHOLDS
12.9/ 100
METRIC RATING
201st/ 347
METRIC RANK
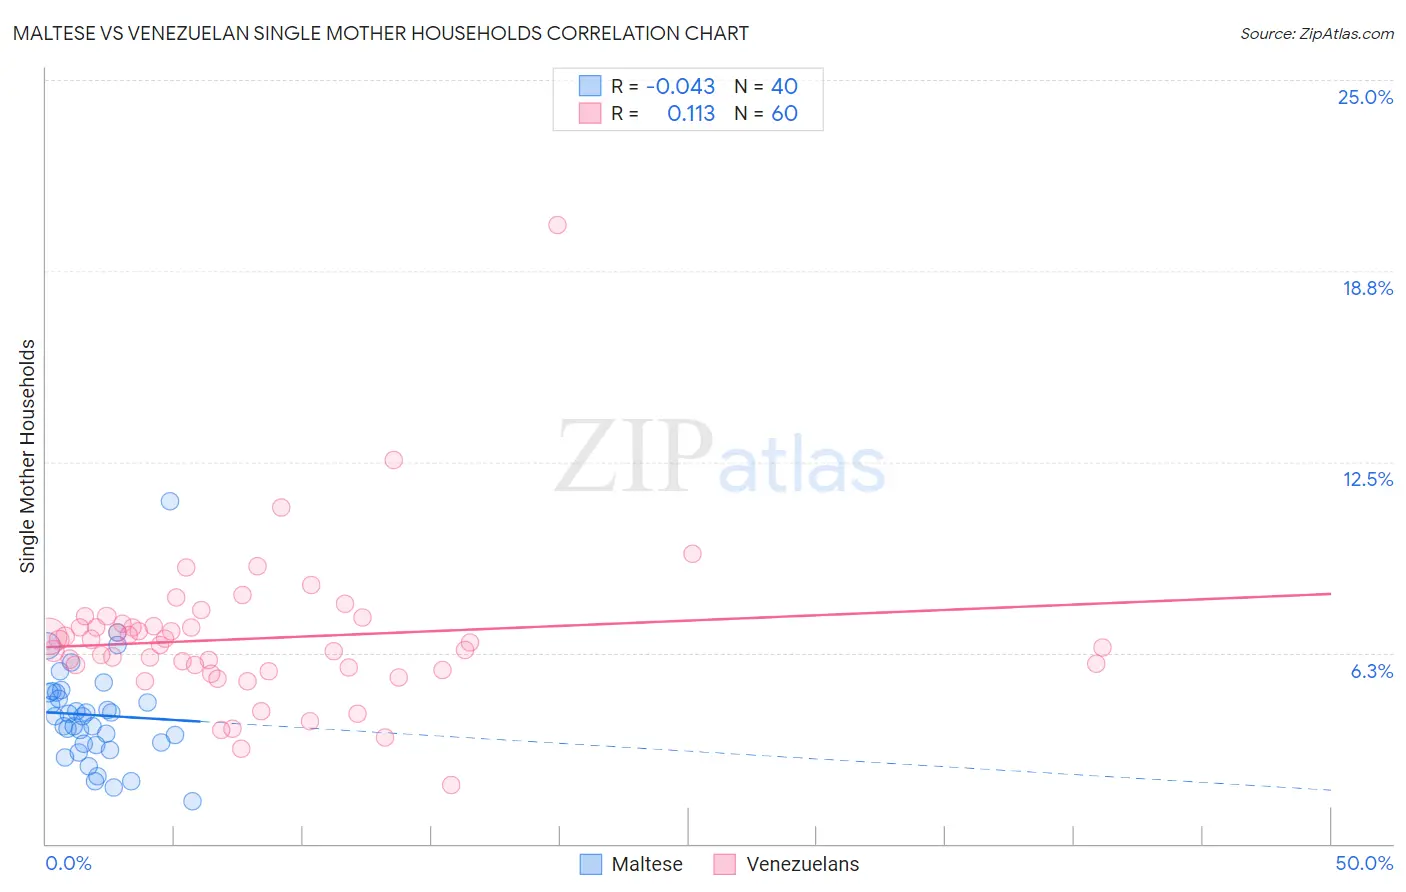
Maltese vs Venezuelan Single Mother Households Correlation Chart
The statistical analysis conducted on geographies consisting of 126,155,970 people shows no correlation between the proportion of Maltese and percentage of single mother households in the United States with a correlation coefficient (R) of -0.043 and weighted average of 5.2%. Similarly, the statistical analysis conducted on geographies consisting of 305,713,790 people shows a poor positive correlation between the proportion of Venezuelans and percentage of single mother households in the United States with a correlation coefficient (R) of 0.113 and weighted average of 6.6%, a difference of 28.0%.
Single Mother Households Correlation Summary
| Measurement | Maltese | Venezuelan |
| Minimum | 1.4% | 1.9% |
| Maximum | 11.2% | 20.3% |
| Range | 9.8% | 18.4% |
| Mean | 4.2% | 6.7% |
| Median | 4.2% | 6.6% |
| Interquartile 25% (IQ1) | 3.3% | 5.7% |
| Interquartile 75% (IQ3) | 4.9% | 7.2% |
| Interquartile Range (IQR) | 1.7% | 1.4% |
| Standard Deviation (Sample) | 1.7% | 2.5% |
| Standard Deviation (Population) | 1.7% | 2.5% |
Similar Demographics by Single Mother Households
Demographics Similar to Maltese by Single Mother Households
In terms of single mother households, the demographic groups most similar to Maltese are Eastern European (5.2%, a difference of 0.060%), Chinese (5.2%, a difference of 0.47%), Immigrants from Armenia (5.2%, a difference of 0.57%), Thai (5.2%, a difference of 0.78%), and Immigrants from Austria (5.2%, a difference of 0.83%).
| Demographics | Rating | Rank | Single Mother Households |
| Immigrants | India | 99.9 /100 | #13 | Exceptional 5.1% |
| Immigrants | Australia | 99.9 /100 | #14 | Exceptional 5.1% |
| Immigrants | Eastern Asia | 99.9 /100 | #15 | Exceptional 5.1% |
| Indians (Asian) | 99.9 /100 | #16 | Exceptional 5.1% |
| Soviet Union | 99.9 /100 | #17 | Exceptional 5.1% |
| Immigrants | Armenia | 99.9 /100 | #18 | Exceptional 5.2% |
| Chinese | 99.9 /100 | #19 | Exceptional 5.2% |
| Maltese | 99.9 /100 | #20 | Exceptional 5.2% |
| Eastern Europeans | 99.8 /100 | #21 | Exceptional 5.2% |
| Thais | 99.8 /100 | #22 | Exceptional 5.2% |
| Immigrants | Austria | 99.8 /100 | #23 | Exceptional 5.2% |
| Armenians | 99.8 /100 | #24 | Exceptional 5.2% |
| Immigrants | Japan | 99.8 /100 | #25 | Exceptional 5.2% |
| Immigrants | Lithuania | 99.8 /100 | #26 | Exceptional 5.3% |
| Bhutanese | 99.7 /100 | #27 | Exceptional 5.3% |
Demographics Similar to Venezuelans by Single Mother Households
In terms of single mother households, the demographic groups most similar to Venezuelans are Guamanian/Chamorro (6.6%, a difference of 0.12%), Immigrants from Peru (6.7%, a difference of 0.21%), Immigrants from Fiji (6.7%, a difference of 0.22%), Cree (6.7%, a difference of 0.24%), and German Russian (6.7%, a difference of 0.32%).
| Demographics | Rating | Rank | Single Mother Households |
| Immigrants | Uganda | 18.3 /100 | #194 | Poor 6.6% |
| South Americans | 18.0 /100 | #195 | Poor 6.6% |
| Uruguayans | 18.0 /100 | #196 | Poor 6.6% |
| Moroccans | 17.4 /100 | #197 | Poor 6.6% |
| Hawaiians | 16.1 /100 | #198 | Poor 6.6% |
| Potawatomi | 15.5 /100 | #199 | Poor 6.6% |
| Immigrants | Ethiopia | 14.7 /100 | #200 | Poor 6.6% |
| Venezuelans | 12.9 /100 | #201 | Poor 6.6% |
| Guamanians/Chamorros | 12.4 /100 | #202 | Poor 6.6% |
| Immigrants | Peru | 12.0 /100 | #203 | Poor 6.7% |
| Immigrants | Fiji | 11.9 /100 | #204 | Poor 6.7% |
| Cree | 11.9 /100 | #205 | Poor 6.7% |
| German Russians | 11.5 /100 | #206 | Poor 6.7% |
| Immigrants | South America | 11.5 /100 | #207 | Poor 6.7% |
| Vietnamese | 11.3 /100 | #208 | Poor 6.7% |