Pakistani vs European Family Households
COMPARE
Pakistani
European
Family Households
Family Households Comparison
Pakistanis
Europeans
64.7%
FAMILY HOUSEHOLDS
84.0/ 100
METRIC RATING
142nd/ 347
METRIC RANK
65.0%
FAMILY HOUSEHOLDS
96.8/ 100
METRIC RATING
111th/ 347
METRIC RANK
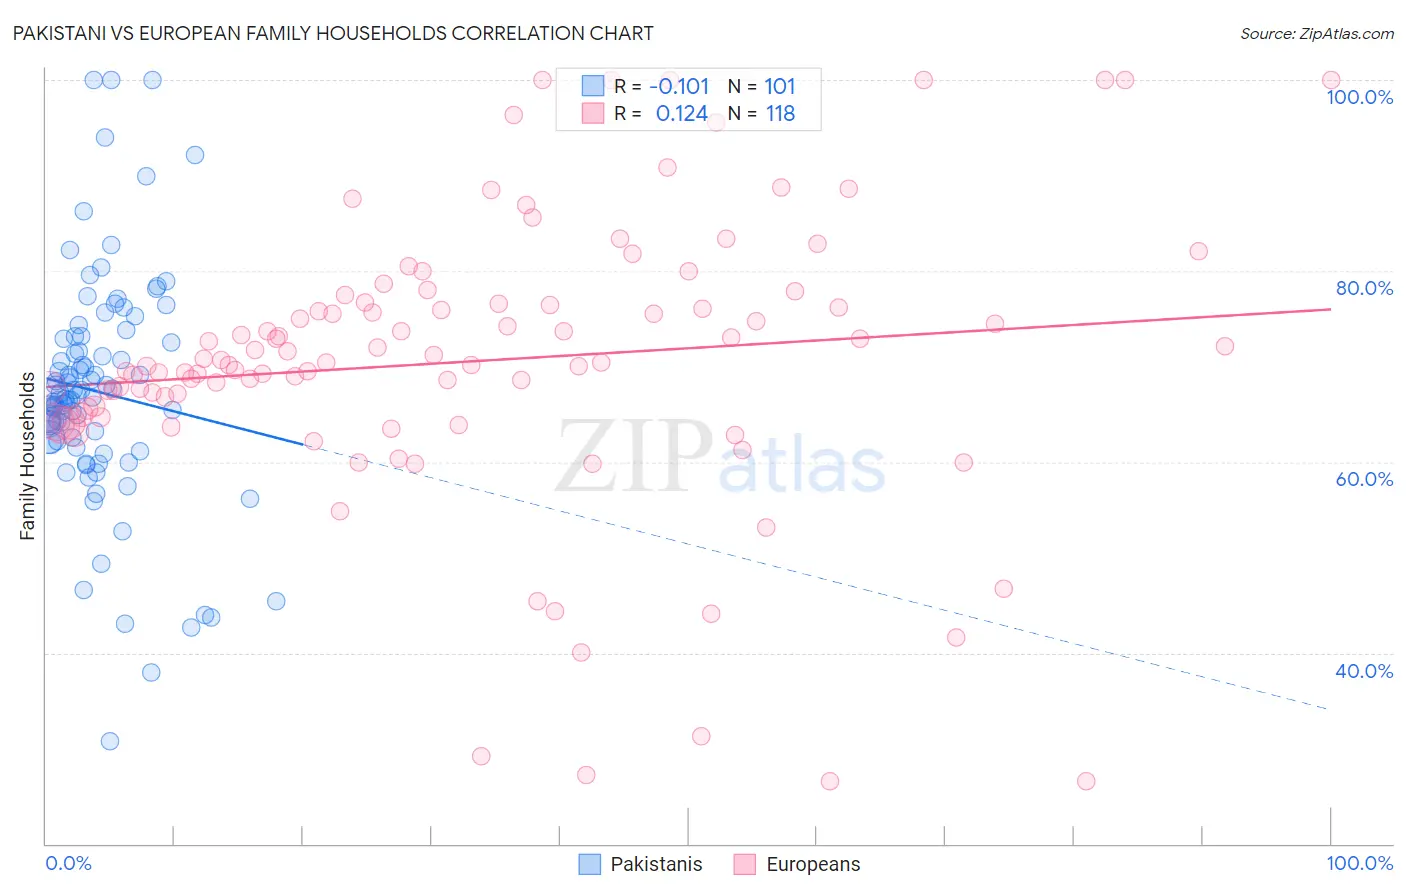
Pakistani vs European Family Households Correlation Chart
The statistical analysis conducted on geographies consisting of 335,180,363 people shows a poor negative correlation between the proportion of Pakistanis and percentage of family households in the United States with a correlation coefficient (R) of -0.101 and weighted average of 64.7%. Similarly, the statistical analysis conducted on geographies consisting of 561,245,057 people shows a poor positive correlation between the proportion of Europeans and percentage of family households in the United States with a correlation coefficient (R) of 0.124 and weighted average of 65.0%, a difference of 0.58%.
Family Households Correlation Summary
| Measurement | Pakistani | European |
| Minimum | 30.8% | 26.5% |
| Maximum | 100.0% | 100.0% |
| Range | 69.2% | 73.5% |
| Mean | 67.3% | 70.5% |
| Median | 66.7% | 70.4% |
| Interquartile 25% (IQ1) | 62.1% | 65.0% |
| Interquartile 75% (IQ3) | 73.0% | 76.5% |
| Interquartile Range (IQR) | 10.9% | 11.6% |
| Standard Deviation (Sample) | 12.1% | 15.0% |
| Standard Deviation (Population) | 12.0% | 15.0% |
Similar Demographics by Family Households
Demographics Similar to Pakistanis by Family Households
In terms of family households, the demographic groups most similar to Pakistanis are Immigrants from North Macedonia (64.7%, a difference of 0.020%), Immigrants from Cameroon (64.7%, a difference of 0.020%), Immigrants from Jamaica (64.7%, a difference of 0.030%), Basque (64.7%, a difference of 0.040%), and Czechoslovakian (64.6%, a difference of 0.050%).
| Demographics | Rating | Rank | Family Households |
| Maltese | 87.4 /100 | #135 | Excellent 64.7% |
| Immigrants | China | 86.6 /100 | #136 | Excellent 64.7% |
| Immigrants | Scotland | 86.4 /100 | #137 | Excellent 64.7% |
| Basques | 85.5 /100 | #138 | Excellent 64.7% |
| Immigrants | Jamaica | 85.3 /100 | #139 | Excellent 64.7% |
| Immigrants | North Macedonia | 84.9 /100 | #140 | Excellent 64.7% |
| Immigrants | Cameroon | 84.8 /100 | #141 | Excellent 64.7% |
| Pakistanis | 84.0 /100 | #142 | Excellent 64.7% |
| Czechoslovakians | 82.1 /100 | #143 | Excellent 64.6% |
| South American Indians | 81.9 /100 | #144 | Excellent 64.6% |
| Welsh | 80.1 /100 | #145 | Excellent 64.6% |
| Immigrants | Romania | 77.0 /100 | #146 | Good 64.6% |
| Immigrants | Chile | 76.5 /100 | #147 | Good 64.6% |
| Delaware | 76.3 /100 | #148 | Good 64.6% |
| Sioux | 76.3 /100 | #149 | Good 64.6% |
Demographics Similar to Europeans by Family Households
In terms of family households, the demographic groups most similar to Europeans are Scandinavian (65.0%, a difference of 0.0%), Immigrants from Guatemala (65.0%, a difference of 0.010%), Immigrants from Jordan (65.0%, a difference of 0.030%), Palestinian (65.1%, a difference of 0.050%), and Alaska Native (65.1%, a difference of 0.060%).
| Demographics | Rating | Rank | Family Households |
| Spaniards | 97.8 /100 | #104 | Exceptional 65.1% |
| English | 97.4 /100 | #105 | Exceptional 65.1% |
| Whites/Caucasians | 97.3 /100 | #106 | Exceptional 65.1% |
| Alaska Natives | 97.3 /100 | #107 | Exceptional 65.1% |
| Palestinians | 97.2 /100 | #108 | Exceptional 65.1% |
| Immigrants | Guatemala | 96.9 /100 | #109 | Exceptional 65.0% |
| Scandinavians | 96.8 /100 | #110 | Exceptional 65.0% |
| Europeans | 96.8 /100 | #111 | Exceptional 65.0% |
| Immigrants | Jordan | 96.5 /100 | #112 | Exceptional 65.0% |
| Spanish | 96.2 /100 | #113 | Exceptional 65.0% |
| Argentineans | 95.7 /100 | #114 | Exceptional 65.0% |
| Ecuadorians | 95.4 /100 | #115 | Exceptional 65.0% |
| Immigrants | Iraq | 95.4 /100 | #116 | Exceptional 65.0% |
| Cherokee | 95.3 /100 | #117 | Exceptional 65.0% |
| Dutch | 95.1 /100 | #118 | Exceptional 64.9% |