Immigrants from Kazakhstan vs European Family Households
COMPARE
Immigrants from Kazakhstan
European
Family Households
Family Households Comparison
Immigrants from Kazakhstan
Europeans
63.1%
FAMILY HOUSEHOLDS
0.3/ 100
METRIC RATING
273rd/ 347
METRIC RANK
65.0%
FAMILY HOUSEHOLDS
96.8/ 100
METRIC RATING
111th/ 347
METRIC RANK
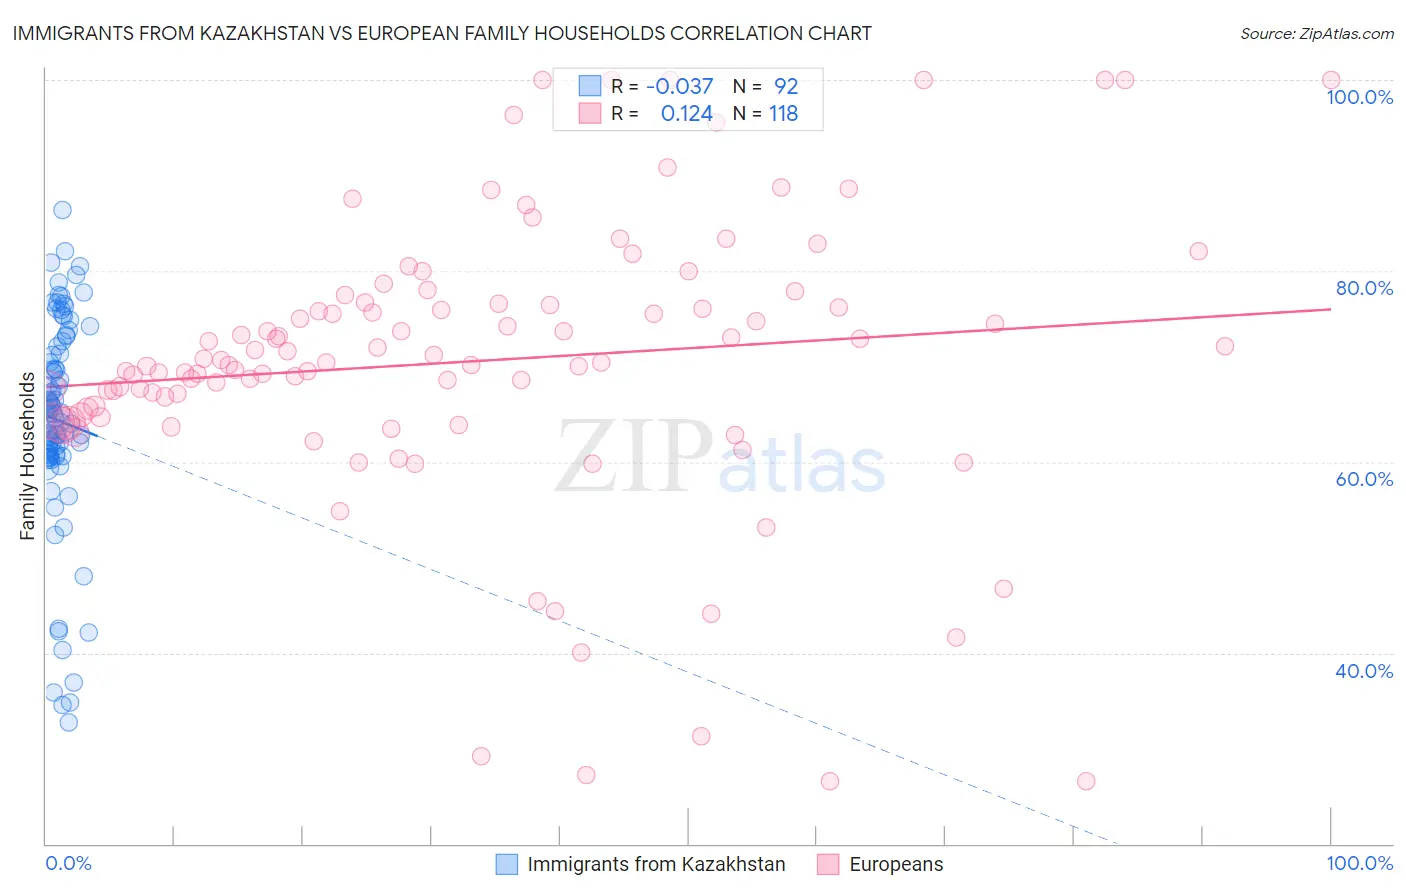
Immigrants from Kazakhstan vs European Family Households Correlation Chart
The statistical analysis conducted on geographies consisting of 124,429,118 people shows no correlation between the proportion of Immigrants from Kazakhstan and percentage of family households in the United States with a correlation coefficient (R) of -0.037 and weighted average of 63.1%. Similarly, the statistical analysis conducted on geographies consisting of 561,245,057 people shows a poor positive correlation between the proportion of Europeans and percentage of family households in the United States with a correlation coefficient (R) of 0.124 and weighted average of 65.0%, a difference of 3.1%.
Family Households Correlation Summary
| Measurement | Immigrants from Kazakhstan | European |
| Minimum | 32.8% | 26.5% |
| Maximum | 86.3% | 100.0% |
| Range | 53.6% | 73.5% |
| Mean | 64.3% | 70.5% |
| Median | 65.0% | 70.4% |
| Interquartile 25% (IQ1) | 60.7% | 65.0% |
| Interquartile 75% (IQ3) | 72.3% | 76.5% |
| Interquartile Range (IQR) | 11.7% | 11.6% |
| Standard Deviation (Sample) | 11.3% | 15.0% |
| Standard Deviation (Population) | 11.3% | 15.0% |
Similar Demographics by Family Households
Demographics Similar to Immigrants from Kazakhstan by Family Households
In terms of family households, the demographic groups most similar to Immigrants from Kazakhstan are Immigrants from Croatia (63.1%, a difference of 0.010%), Immigrants from Turkey (63.1%, a difference of 0.010%), Lumbee (63.1%, a difference of 0.010%), West Indian (63.1%, a difference of 0.010%), and Immigrants from Austria (63.1%, a difference of 0.020%).
| Demographics | Rating | Rank | Family Households |
| Immigrants | Western Africa | 0.5 /100 | #266 | Tragic 63.1% |
| Israelis | 0.4 /100 | #267 | Tragic 63.1% |
| Immigrants | Singapore | 0.4 /100 | #268 | Tragic 63.1% |
| Yugoslavians | 0.4 /100 | #269 | Tragic 63.1% |
| Immigrants | Austria | 0.3 /100 | #270 | Tragic 63.1% |
| Immigrants | Croatia | 0.3 /100 | #271 | Tragic 63.1% |
| Immigrants | Turkey | 0.3 /100 | #272 | Tragic 63.1% |
| Immigrants | Kazakhstan | 0.3 /100 | #273 | Tragic 63.1% |
| Lumbee | 0.3 /100 | #274 | Tragic 63.1% |
| West Indians | 0.3 /100 | #275 | Tragic 63.1% |
| Serbians | 0.3 /100 | #276 | Tragic 63.0% |
| Ottawa | 0.3 /100 | #277 | Tragic 63.0% |
| Immigrants | Belgium | 0.2 /100 | #278 | Tragic 63.0% |
| Immigrants | Yemen | 0.2 /100 | #279 | Tragic 63.0% |
| Immigrants | Bulgaria | 0.2 /100 | #280 | Tragic 63.0% |
Demographics Similar to Europeans by Family Households
In terms of family households, the demographic groups most similar to Europeans are Scandinavian (65.0%, a difference of 0.0%), Immigrants from Guatemala (65.0%, a difference of 0.010%), Immigrants from Jordan (65.0%, a difference of 0.030%), Palestinian (65.1%, a difference of 0.050%), and Alaska Native (65.1%, a difference of 0.060%).
| Demographics | Rating | Rank | Family Households |
| Spaniards | 97.8 /100 | #104 | Exceptional 65.1% |
| English | 97.4 /100 | #105 | Exceptional 65.1% |
| Whites/Caucasians | 97.3 /100 | #106 | Exceptional 65.1% |
| Alaska Natives | 97.3 /100 | #107 | Exceptional 65.1% |
| Palestinians | 97.2 /100 | #108 | Exceptional 65.1% |
| Immigrants | Guatemala | 96.9 /100 | #109 | Exceptional 65.0% |
| Scandinavians | 96.8 /100 | #110 | Exceptional 65.0% |
| Europeans | 96.8 /100 | #111 | Exceptional 65.0% |
| Immigrants | Jordan | 96.5 /100 | #112 | Exceptional 65.0% |
| Spanish | 96.2 /100 | #113 | Exceptional 65.0% |
| Argentineans | 95.7 /100 | #114 | Exceptional 65.0% |
| Ecuadorians | 95.4 /100 | #115 | Exceptional 65.0% |
| Immigrants | Iraq | 95.4 /100 | #116 | Exceptional 65.0% |
| Cherokee | 95.3 /100 | #117 | Exceptional 65.0% |
| Dutch | 95.1 /100 | #118 | Exceptional 64.9% |