Paiute vs Immigrants from Austria Family Households with Children

COMPARE

Paiute
Race
Ancestry
AfghanAfricanAlaska NativeAlaskan AthabascanAlbanianAleutAlsatianAmericanApacheArabArapahoArgentineanArmenianAssyrian/Chaldean/SyriacAustralianAustrianBahamianBangladeshiBarbadianBasqueBelgianBelizeanBermudanBhutaneseBlackfeetBolivianBrazilianBritishBritish West IndianBulgarianBurmeseCajunCambodianCanadianCape VerdeanCarpatho RusynCelticCentral AmericanCentral American IndianCherokeeCheyenneChickasawChileanChineseChippewaChoctawColombianColvilleComancheCosta RicanCreeCreekCroatianCrowCubanCypriotCzechCzechoslovakianDanishDelawareDominicanDutchDutch West IndianEastern EuropeanEcuadorianEgyptianEnglishEstonianEthiopianEuropeanFijianFilipinoFinnishFrenchFrench American IndianFrench CanadianGermanGerman RussianGhanaianGreekGuamanian/ChamorroGuatemalanGuyaneseHaitianHmongHonduranHopiHoumaHungarianIcelanderIndian (Asian)IndonesianInupiatIranianIraqiIrishIroquoisIsraeliItalianJamaicanJapaneseJordanianKenyanKiowaKoreanLaotianLatvianLebaneseLiberianLithuanianLumbeeLuxembourgerMacedonianMalaysianMalteseMarshalleseMenomineeMexicanMexican American IndianMongolianMoroccanNative HawaiianNavajoNepaleseNew ZealanderNicaraguanNigerianNorthern EuropeanNorwegianOkinawanOsageOttawaPaiutePakistaniPalestinianPanamanianParaguayanPennsylvania GermanPeruvianPimaPolishPortuguesePotawatomiPuebloPuerto RicanPuget Sound SalishRomanianRussianSalvadoranSamoanScandinavianScotch-IrishScottishSeminoleSenegaleseSerbianShoshoneSierra LeoneanSiouxSlavicSlovakSloveneSomaliSouth AfricanSouth AmericanSouth American IndianSoviet UnionSpaniardSpanishSpanish AmericanSpanish American IndianSri LankanSubsaharan AfricanSudaneseSwedishSwissSyrianTaiwaneseThaiTlingit-HaidaTohono O'OdhamTonganTrinidadian and TobagonianTsimshianTurkishU.S. Virgin IslanderUgandanUkrainianUruguayanUteVenezuelanVietnameseWelshWest IndianYakamaYaquiYugoslavianYumanYup'ikZimbabwean
Immigration
NonimmigrantsImmigrantsAfghanistanAfricaAlbaniaArgentinaArmeniaAsiaAustraliaBahamasBangladeshBarbadosBelarusBelgiumBelizeBoliviaBosnia and HerzegovinaBrazilBulgariaBurma/MyanmarCabo VerdeCambodiaCameroonCanadaCaribbeanCentral AmericaChileChinaColombiaCongoCosta RicaCroatiaCubaCzechoslovakiaDenmarkDominicaDominican RepublicEastern AfricaEastern AsiaEastern EuropeEcuadorEgyptEl SalvadorEnglandEritreaEthiopiaEuropeFijiFranceGermanyGhanaGreeceGrenadaGuatemalaGuyanaHaitiHondurasHong KongHungaryIndiaIndonesiaIranIraqIrelandIsraelItalyJamaicaJapanJordanKazakhstanKenyaKoreaKuwaitLaosLatin AmericaLatviaLebanonLiberiaLithuaniaMalaysiaMexicoMicronesiaMiddle AfricaMoldovaMoroccoNepalNetherlandsNicaraguaNigeriaNorth AmericaNorth MacedoniaNorthern AfricaNorthern EuropeNorwayOceaniaPakistanPanamaPeruPhilippinesPolandPortugalRomaniaRussiaSaudi ArabiaScotlandSenegalSerbiaSierra LeoneSingaporeSomaliaSouth AfricaSouth AmericaSouth Central AsiaSouth Eastern AsiaSouthern EuropeSpainSri LankaSt. Vincent and the GrenadinesSudanSwedenSwitzerlandSyriaTaiwanThailandTrinidad and TobagoTurkeyUgandaUkraineUruguayUzbekistanVenezuelaVietnamWest IndiesWestern AfricaWestern AsiaWestern EuropeYemenZaireZimbabweAzores
Immigrants from Austria
Race
Ancestry
AfghanAfricanAlaska NativeAlaskan AthabascanAlbanianAleutAlsatianAmericanApacheArabArapahoArgentineanArmenianAssyrian/Chaldean/SyriacAustralianAustrianBahamianBangladeshiBarbadianBasqueBelgianBelizeanBermudanBhutaneseBlackfeetBolivianBrazilianBritishBritish West IndianBulgarianBurmeseCajunCambodianCanadianCape VerdeanCarpatho RusynCelticCentral AmericanCentral American IndianCherokeeCheyenneChickasawChileanChineseChippewaChoctawColombianColvilleComancheCosta RicanCreeCreekCroatianCrowCubanCypriotCzechCzechoslovakianDanishDelawareDominicanDutchDutch West IndianEastern EuropeanEcuadorianEgyptianEnglishEstonianEthiopianEuropeanFijianFilipinoFinnishFrenchFrench American IndianFrench CanadianGermanGerman RussianGhanaianGreekGuamanian/ChamorroGuatemalanGuyaneseHaitianHmongHonduranHopiHoumaHungarianIcelanderIndian (Asian)IndonesianInupiatIranianIraqiIrishIroquoisIsraeliItalianJamaicanJapaneseJordanianKenyanKiowaKoreanLaotianLatvianLebaneseLiberianLithuanianLumbeeLuxembourgerMacedonianMalaysianMalteseMarshalleseMenomineeMexicanMexican American IndianMongolianMoroccanNative HawaiianNavajoNepaleseNew ZealanderNicaraguanNigerianNorthern EuropeanNorwegianOkinawanOsageOttawaPakistaniPalestinianPanamanianParaguayanPennsylvania GermanPeruvianPimaPolishPortuguesePotawatomiPuebloPuerto RicanPuget Sound SalishRomanianRussianSalvadoranSamoanScandinavianScotch-IrishScottishSeminoleSenegaleseSerbianShoshoneSierra LeoneanSiouxSlavicSlovakSloveneSomaliSouth AfricanSouth AmericanSouth American IndianSoviet UnionSpaniardSpanishSpanish AmericanSpanish American IndianSri LankanSubsaharan AfricanSudaneseSwedishSwissSyrianTaiwaneseThaiTlingit-HaidaTohono O'OdhamTonganTrinidadian and TobagonianTsimshianTurkishU.S. Virgin IslanderUgandanUkrainianUruguayanUteVenezuelanVietnameseWelshWest IndianYakamaYaquiYugoslavianYumanYup'ikZimbabwean
Immigration
NonimmigrantsImmigrantsAfghanistanAfricaAlbaniaArgentinaArmeniaAsiaAustraliaAustriaBahamasBangladeshBarbadosBelarusBelgiumBelizeBoliviaBosnia and HerzegovinaBrazilBulgariaBurma/MyanmarCabo VerdeCambodiaCameroonCanadaCaribbeanCentral AmericaChileChinaColombiaCongoCosta RicaCroatiaCubaCzechoslovakiaDenmarkDominicaDominican RepublicEastern AfricaEastern AsiaEastern EuropeEcuadorEgyptEl SalvadorEnglandEritreaEthiopiaEuropeFijiFranceGermanyGhanaGreeceGrenadaGuatemalaGuyanaHaitiHondurasHong KongHungaryIndiaIndonesiaIranIraqIrelandIsraelItalyJamaicaJapanJordanKazakhstanKenyaKoreaKuwaitLaosLatin AmericaLatviaLebanonLiberiaLithuaniaMalaysiaMexicoMicronesiaMiddle AfricaMoldovaMoroccoNepalNetherlandsNicaraguaNigeriaNorth AmericaNorth MacedoniaNorthern AfricaNorthern EuropeNorwayOceaniaPakistanPanamaPeruPhilippinesPolandPortugalRomaniaRussiaSaudi ArabiaScotlandSenegalSerbiaSierra LeoneSingaporeSomaliaSouth AfricaSouth AmericaSouth Central AsiaSouth Eastern AsiaSouthern EuropeSpainSri LankaSt. Vincent and the GrenadinesSudanSwedenSwitzerlandSyriaTaiwanThailandTrinidad and TobagoTurkeyUgandaUkraineUruguayUzbekistanVenezuelaVietnamWest IndiesWestern AfricaWestern AsiaWestern EuropeYemenZaireZimbabweAzores
Family Households with Children
Income
Poverty
Unemployment
Labor Participation
Family Structure
Vehicle Availability
Education Level
Disability

Family Households with Children Comparison

Paiute

Immigrants from Austria

Tragic
Tragic
26.4%
FAMILY HOUSEHOLDS WITH CHILDREN
0.1/ 100
METRIC RATING
300th/ 347
METRIC RANK
25.8%
FAMILY HOUSEHOLDS WITH CHILDREN
0.0/ 100
METRIC RATING
332nd/ 347
METRIC RANK

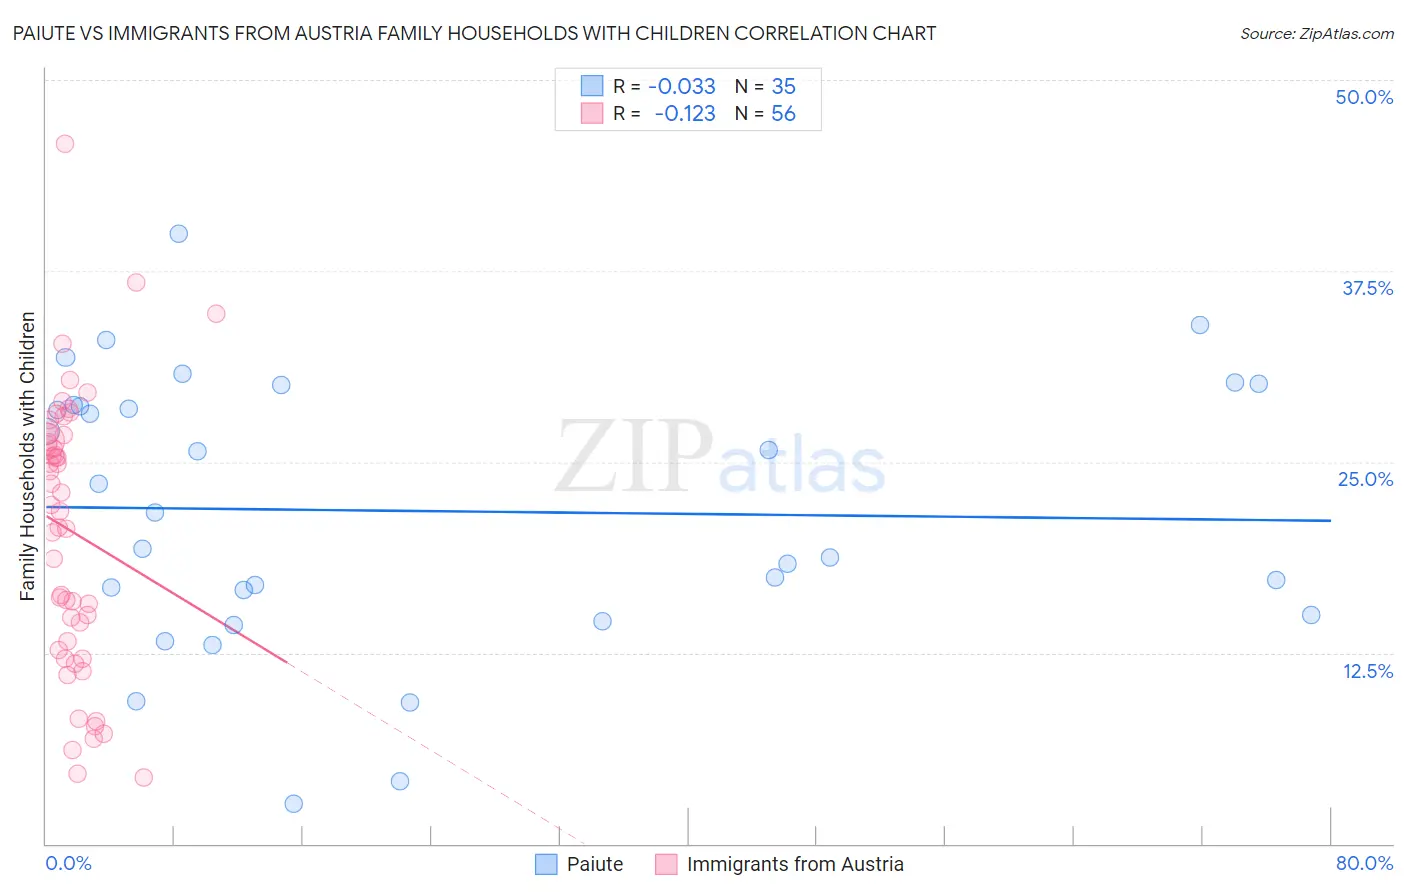
Paiute vs Immigrants from Austria Family Households with Children Correlation Chart

The statistical analysis conducted on geographies consisting of 58,389,869 people shows no correlation between the proportion of Paiute and percentage of family households with children in the United States with a correlation coefficient (R) of -0.033 and weighted average of 26.4%. Similarly, the statistical analysis conducted on geographies consisting of 167,913,233 people shows a poor negative correlation between the proportion of Immigrants from Austria and percentage of family households with children in the United States with a correlation coefficient (R) of -0.123 and weighted average of 25.8%, a difference of 2.3%.
Paiute vs Immigrants from Austria Family Households with Children

Family Households with Children Correlation Summary

MeasurementPaiuteImmigrants from Austria
Minimum2.7%4.3%
Maximum40.0%45.8%
Range37.3%41.5%
Mean21.8%20.5%
Median21.6%22.0%
Interquartile 25% (IQ1)15.0%13.0%
Interquartile 75% (IQ3)28.7%26.6%
Interquartile Range (IQR)13.8%13.6%
Standard Deviation (Sample)8.9%9.0%
Standard Deviation (Population)8.8%8.9%

Similar Demographics by Family Households with Children

Demographics Similar to Paiute by Family Households with Children

In terms of family households with children, the demographic groups most similar to Paiute are Immigrants from Trinidad and Tobago (26.4%, a difference of 0.020%), Serbian (26.4%, a difference of 0.030%), Immigrants from Guyana (26.3%, a difference of 0.060%), Immigrants from Bahamas (26.3%, a difference of 0.11%), and Trinidadian and Tobagonian (26.4%, a difference of 0.12%).
DemographicsRating | RankFamily Households with Children
Blacks/African Americans
0.1
/100
|
#293
Tragic
26.5%
Latvians
0.1
/100
|
#294
Tragic
26.4%
Macedonians
0.1
/100
|
#295
Tragic
26.4%
Croatians
0.1
/100
|
#296
Tragic
26.4%
Armenians
0.1
/100
|
#297
Tragic
26.4%
Immigrants | Western Europe
0.1
/100
|
#298
Tragic
26.4%
Trinidadians and Tobagonians
0.1
/100
|
#299
Tragic
26.4%
Paiute
0.1
/100
|
#300
Tragic
26.4%
Immigrants | Trinidad and Tobago
0.1
/100
|
#301
Tragic
26.4%
Serbians
0.1
/100
|
#302
Tragic
26.4%
Immigrants | Guyana
0.1
/100
|
#303
Tragic
26.3%
Immigrants | Bahamas
0.1
/100
|
#304
Tragic
26.3%
Guyanese
0.1
/100
|
#305
Tragic
26.3%
Bermudans
0.1
/100
|
#306
Tragic
26.3%
West Indians
0.0
/100
|
#307
Tragic
26.3%

Demographics Similar to Immigrants from Austria by Family Households with Children

In terms of family households with children, the demographic groups most similar to Immigrants from Austria are Immigrants from Switzerland (25.7%, a difference of 0.080%), Slovene (25.8%, a difference of 0.23%), Slovak (25.7%, a difference of 0.23%), Immigrants from Croatia (25.7%, a difference of 0.24%), and Immigrants from West Indies (25.7%, a difference of 0.34%).
DemographicsRating | RankFamily Households with Children
Barbadians
0.0
/100
|
#325
Tragic
26.0%
Immigrants | Ireland
0.0
/100
|
#326
Tragic
26.0%
Immigrants | Barbados
0.0
/100
|
#327
Tragic
26.0%
Immigrants | Albania
0.0
/100
|
#328
Tragic
25.9%
Cypriots
0.0
/100
|
#329
Tragic
25.9%
Immigrants | Latvia
0.0
/100
|
#330
Tragic
25.9%
Slovenes
0.0
/100
|
#331
Tragic
25.8%
Immigrants | Austria
0.0
/100
|
#332
Tragic
25.8%
Immigrants | Switzerland
0.0
/100
|
#333
Tragic
25.7%
Slovaks
0.0
/100
|
#334
Tragic
25.7%
Immigrants | Croatia
0.0
/100
|
#335
Tragic
25.7%
Immigrants | West Indies
0.0
/100
|
#336
Tragic
25.7%
Puerto Ricans
0.0
/100
|
#337
Tragic
25.6%
Arapaho
0.0
/100
|
#338
Tragic
25.6%
Immigrants | St. Vincent and the Grenadines
0.0
/100
|
#339
Tragic
25.6%