Immigrants from Bahamas vs Immigrants from Austria Family Households with Children
COMPARE
Immigrants from Bahamas
Immigrants from Austria
Family Households with Children
Family Households with Children Comparison
Immigrants from Bahamas
Immigrants from Austria
26.3%
FAMILY HOUSEHOLDS WITH CHILDREN
0.1/ 100
METRIC RATING
304th/ 347
METRIC RANK
25.8%
FAMILY HOUSEHOLDS WITH CHILDREN
0.0/ 100
METRIC RATING
332nd/ 347
METRIC RANK
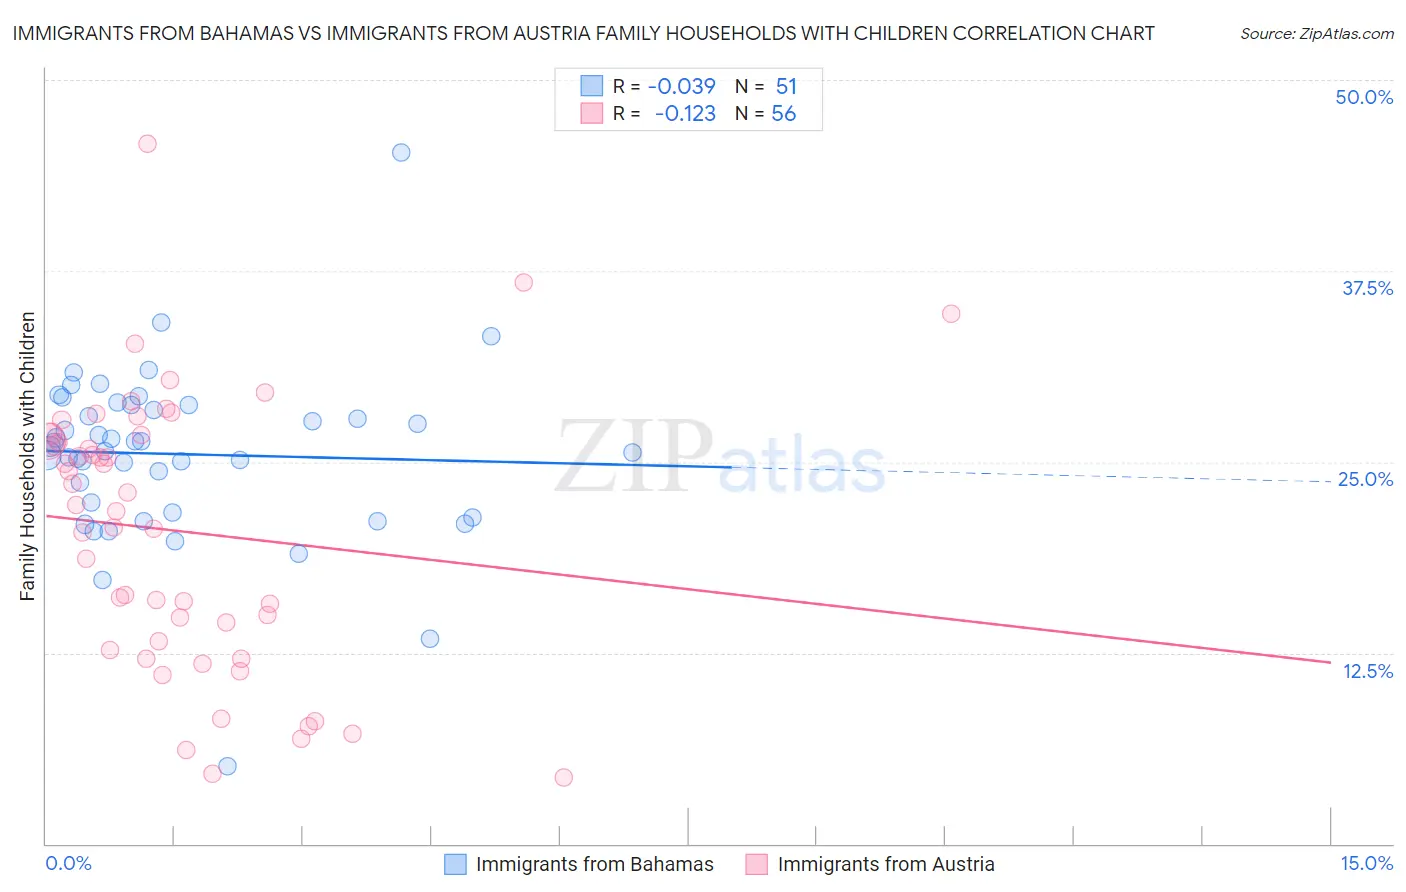
Immigrants from Bahamas vs Immigrants from Austria Family Households with Children Correlation Chart
The statistical analysis conducted on geographies consisting of 104,549,711 people shows no correlation between the proportion of Immigrants from Bahamas and percentage of family households with children in the United States with a correlation coefficient (R) of -0.039 and weighted average of 26.3%. Similarly, the statistical analysis conducted on geographies consisting of 167,913,233 people shows a poor negative correlation between the proportion of Immigrants from Austria and percentage of family households with children in the United States with a correlation coefficient (R) of -0.123 and weighted average of 25.8%, a difference of 2.2%.
Family Households with Children Correlation Summary
| Measurement | Immigrants from Bahamas | Immigrants from Austria |
| Minimum | 5.1% | 4.3% |
| Maximum | 45.3% | 45.8% |
| Range | 40.2% | 41.5% |
| Mean | 25.5% | 20.5% |
| Median | 26.0% | 22.0% |
| Interquartile 25% (IQ1) | 21.7% | 13.0% |
| Interquartile 75% (IQ3) | 28.7% | 26.6% |
| Interquartile Range (IQR) | 7.1% | 13.6% |
| Standard Deviation (Sample) | 5.7% | 9.0% |
| Standard Deviation (Population) | 5.6% | 8.9% |
Similar Demographics by Family Households with Children
Demographics Similar to Immigrants from Bahamas by Family Households with Children
In terms of family households with children, the demographic groups most similar to Immigrants from Bahamas are Guyanese (26.3%, a difference of 0.030%), Bermudan (26.3%, a difference of 0.040%), Immigrants from Guyana (26.3%, a difference of 0.050%), Serbian (26.4%, a difference of 0.080%), and Immigrants from Trinidad and Tobago (26.4%, a difference of 0.090%).
| Demographics | Rating | Rank | Family Households with Children |
| Armenians | 0.1 /100 | #297 | Tragic 26.4% |
| Immigrants | Western Europe | 0.1 /100 | #298 | Tragic 26.4% |
| Trinidadians and Tobagonians | 0.1 /100 | #299 | Tragic 26.4% |
| Paiute | 0.1 /100 | #300 | Tragic 26.4% |
| Immigrants | Trinidad and Tobago | 0.1 /100 | #301 | Tragic 26.4% |
| Serbians | 0.1 /100 | #302 | Tragic 26.4% |
| Immigrants | Guyana | 0.1 /100 | #303 | Tragic 26.3% |
| Immigrants | Bahamas | 0.1 /100 | #304 | Tragic 26.3% |
| Guyanese | 0.1 /100 | #305 | Tragic 26.3% |
| Bermudans | 0.1 /100 | #306 | Tragic 26.3% |
| West Indians | 0.0 /100 | #307 | Tragic 26.3% |
| Lumbee | 0.0 /100 | #308 | Tragic 26.3% |
| Immigrants | Somalia | 0.0 /100 | #309 | Tragic 26.3% |
| Marshallese | 0.0 /100 | #310 | Tragic 26.2% |
| Colville | 0.0 /100 | #311 | Tragic 26.2% |
Demographics Similar to Immigrants from Austria by Family Households with Children
In terms of family households with children, the demographic groups most similar to Immigrants from Austria are Immigrants from Switzerland (25.7%, a difference of 0.080%), Slovene (25.8%, a difference of 0.23%), Slovak (25.7%, a difference of 0.23%), Immigrants from Croatia (25.7%, a difference of 0.24%), and Immigrants from West Indies (25.7%, a difference of 0.34%).
| Demographics | Rating | Rank | Family Households with Children |
| Barbadians | 0.0 /100 | #325 | Tragic 26.0% |
| Immigrants | Ireland | 0.0 /100 | #326 | Tragic 26.0% |
| Immigrants | Barbados | 0.0 /100 | #327 | Tragic 26.0% |
| Immigrants | Albania | 0.0 /100 | #328 | Tragic 25.9% |
| Cypriots | 0.0 /100 | #329 | Tragic 25.9% |
| Immigrants | Latvia | 0.0 /100 | #330 | Tragic 25.9% |
| Slovenes | 0.0 /100 | #331 | Tragic 25.8% |
| Immigrants | Austria | 0.0 /100 | #332 | Tragic 25.8% |
| Immigrants | Switzerland | 0.0 /100 | #333 | Tragic 25.7% |
| Slovaks | 0.0 /100 | #334 | Tragic 25.7% |
| Immigrants | Croatia | 0.0 /100 | #335 | Tragic 25.7% |
| Immigrants | West Indies | 0.0 /100 | #336 | Tragic 25.7% |
| Puerto Ricans | 0.0 /100 | #337 | Tragic 25.6% |
| Arapaho | 0.0 /100 | #338 | Tragic 25.6% |
| Immigrants | St. Vincent and the Grenadines | 0.0 /100 | #339 | Tragic 25.6% |