Paiute vs Immigrants from Austria 7th Grade
COMPARE
Paiute
Immigrants from Austria
7th Grade
7th Grade Comparison
Paiute
Immigrants from Austria
95.4%
7TH GRADE
1.2/ 100
METRIC RATING
248th/ 347
METRIC RANK
96.9%
7TH GRADE
99.7/ 100
METRIC RATING
64th/ 347
METRIC RANK
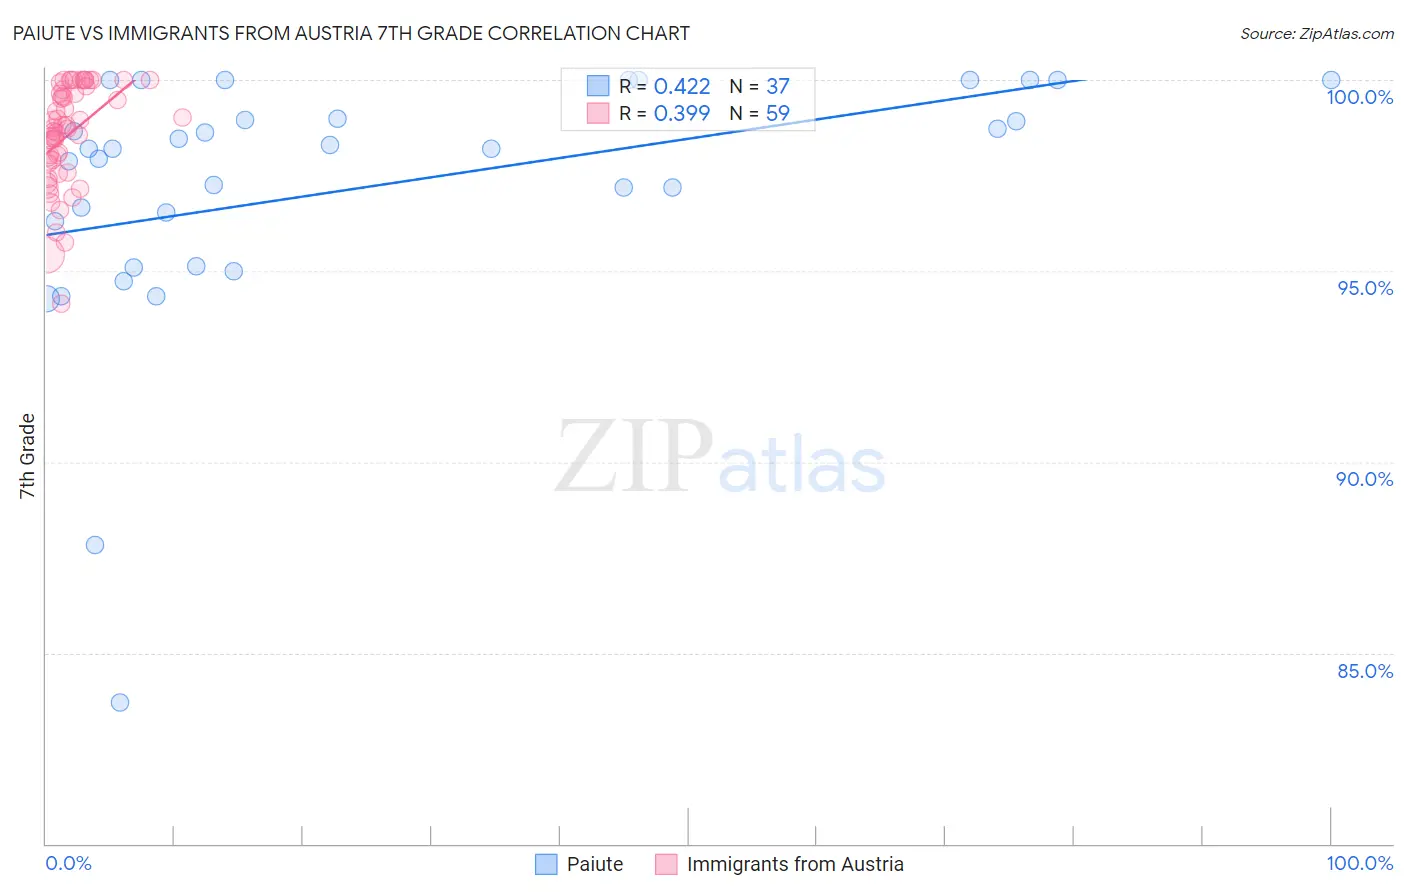
Paiute vs Immigrants from Austria 7th Grade Correlation Chart
The statistical analysis conducted on geographies consisting of 58,403,520 people shows a moderate positive correlation between the proportion of Paiute and percentage of population with at least 7th grade education in the United States with a correlation coefficient (R) of 0.422 and weighted average of 95.4%. Similarly, the statistical analysis conducted on geographies consisting of 167,973,800 people shows a mild positive correlation between the proportion of Immigrants from Austria and percentage of population with at least 7th grade education in the United States with a correlation coefficient (R) of 0.399 and weighted average of 96.9%, a difference of 1.6%.
7th Grade Correlation Summary
| Measurement | Paiute | Immigrants from Austria |
| Minimum | 83.7% | 94.1% |
| Maximum | 100.0% | 100.0% |
| Range | 16.3% | 5.9% |
| Mean | 97.2% | 98.6% |
| Median | 98.2% | 98.8% |
| Interquartile 25% (IQ1) | 95.7% | 97.8% |
| Interquartile 75% (IQ3) | 99.5% | 99.7% |
| Interquartile Range (IQR) | 3.8% | 1.9% |
| Standard Deviation (Sample) | 3.4% | 1.3% |
| Standard Deviation (Population) | 3.3% | 1.3% |
Similar Demographics by 7th Grade
Demographics Similar to Paiute by 7th Grade
In terms of 7th grade, the demographic groups most similar to Paiute are Bolivian (95.4%, a difference of 0.010%), Tongan (95.4%, a difference of 0.020%), Immigrants from Cameroon (95.4%, a difference of 0.030%), Immigrants from Jamaica (95.4%, a difference of 0.030%), and Immigrants from Ethiopia (95.3%, a difference of 0.030%).
| Demographics | Rating | Rank | 7th Grade |
| South American Indians | 2.0 /100 | #241 | Tragic 95.5% |
| Immigrants | Senegal | 1.9 /100 | #242 | Tragic 95.5% |
| U.S. Virgin Islanders | 1.6 /100 | #243 | Tragic 95.4% |
| Uruguayans | 1.6 /100 | #244 | Tragic 95.4% |
| Immigrants | Middle Africa | 1.5 /100 | #245 | Tragic 95.4% |
| Ethiopians | 1.5 /100 | #246 | Tragic 95.4% |
| Tongans | 1.3 /100 | #247 | Tragic 95.4% |
| Paiute | 1.2 /100 | #248 | Tragic 95.4% |
| Bolivians | 1.1 /100 | #249 | Tragic 95.4% |
| Immigrants | Cameroon | 0.9 /100 | #250 | Tragic 95.4% |
| Immigrants | Jamaica | 0.9 /100 | #251 | Tragic 95.4% |
| Immigrants | Ethiopia | 0.9 /100 | #252 | Tragic 95.3% |
| Somalis | 0.9 /100 | #253 | Tragic 95.3% |
| Colombians | 0.8 /100 | #254 | Tragic 95.3% |
| Koreans | 0.8 /100 | #255 | Tragic 95.3% |
Demographics Similar to Immigrants from Austria by 7th Grade
In terms of 7th grade, the demographic groups most similar to Immigrants from Austria are Immigrants from Northern Europe (96.9%, a difference of 0.010%), Canadian (96.9%, a difference of 0.010%), Immigrants from North America (96.9%, a difference of 0.020%), Ukrainian (96.9%, a difference of 0.020%), and Native Hawaiian (96.9%, a difference of 0.020%).
| Demographics | Rating | Rank | 7th Grade |
| Americans | 99.8 /100 | #57 | Exceptional 97.0% |
| Whites/Caucasians | 99.8 /100 | #58 | Exceptional 97.0% |
| Macedonians | 99.8 /100 | #59 | Exceptional 97.0% |
| Immigrants | Canada | 99.8 /100 | #60 | Exceptional 96.9% |
| Creek | 99.8 /100 | #61 | Exceptional 96.9% |
| Immigrants | North America | 99.8 /100 | #62 | Exceptional 96.9% |
| Immigrants | Northern Europe | 99.7 /100 | #63 | Exceptional 96.9% |
| Immigrants | Austria | 99.7 /100 | #64 | Exceptional 96.9% |
| Canadians | 99.7 /100 | #65 | Exceptional 96.9% |
| Ukrainians | 99.7 /100 | #66 | Exceptional 96.9% |
| Native Hawaiians | 99.7 /100 | #67 | Exceptional 96.9% |
| Immigrants | India | 99.6 /100 | #68 | Exceptional 96.9% |
| Iranians | 99.6 /100 | #69 | Exceptional 96.8% |
| New Zealanders | 99.6 /100 | #70 | Exceptional 96.8% |
| Immigrants | Lithuania | 99.6 /100 | #71 | Exceptional 96.8% |