Ottawa vs Serbian Unemployment Among Ages 55 to 59 years
COMPARE
Ottawa
Serbian
Unemployment Among Ages 55 to 59 years
Unemployment Among Ages 55 to 59 years Comparison
Ottawa
Serbians
5.2%
UNEMPLOYMENT AMONG AGES 55 TO 59 YEARS
0.0/ 100
METRIC RATING
273rd/ 347
METRIC RANK
4.7%
UNEMPLOYMENT AMONG AGES 55 TO 59 YEARS
94.4/ 100
METRIC RATING
100th/ 347
METRIC RANK
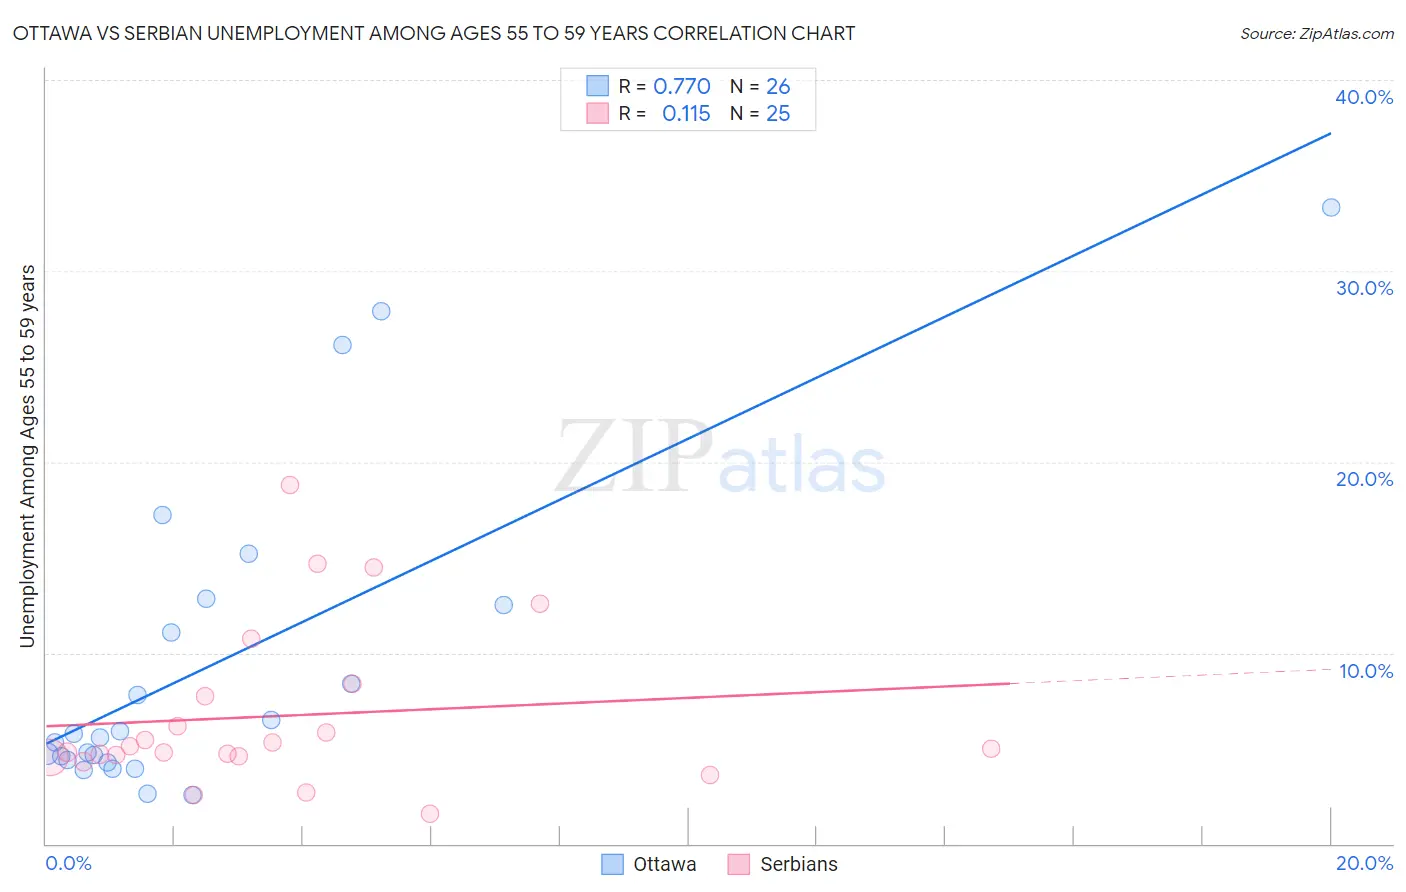
Ottawa vs Serbian Unemployment Among Ages 55 to 59 years Correlation Chart
The statistical analysis conducted on geographies consisting of 48,216,385 people shows a strong positive correlation between the proportion of Ottawa and unemployment rate among population between the ages 55 and 59 in the United States with a correlation coefficient (R) of 0.770 and weighted average of 5.2%. Similarly, the statistical analysis conducted on geographies consisting of 254,232,562 people shows a poor positive correlation between the proportion of Serbians and unemployment rate among population between the ages 55 and 59 in the United States with a correlation coefficient (R) of 0.115 and weighted average of 4.7%, a difference of 11.3%.
Unemployment Among Ages 55 to 59 years Correlation Summary
| Measurement | Ottawa | Serbian |
| Minimum | 2.5% | 1.6% |
| Maximum | 33.3% | 18.8% |
| Range | 30.8% | 17.2% |
| Mean | 9.4% | 6.7% |
| Median | 5.7% | 5.0% |
| Interquartile 25% (IQ1) | 4.4% | 4.6% |
| Interquartile 75% (IQ3) | 12.5% | 8.0% |
| Interquartile Range (IQR) | 8.1% | 3.5% |
| Standard Deviation (Sample) | 8.3% | 4.3% |
| Standard Deviation (Population) | 8.1% | 4.2% |
Similar Demographics by Unemployment Among Ages 55 to 59 years
Demographics Similar to Ottawa by Unemployment Among Ages 55 to 59 years
In terms of unemployment among ages 55 to 59 years, the demographic groups most similar to Ottawa are Mexican American Indian (5.2%, a difference of 0.12%), Israeli (5.2%, a difference of 0.22%), Immigrants from Jamaica (5.2%, a difference of 0.23%), West Indian (5.2%, a difference of 0.23%), and Immigrants from Latin America (5.2%, a difference of 0.35%).
| Demographics | Rating | Rank | Unemployment Among Ages 55 to 59 years |
| Jamaicans | 0.1 /100 | #266 | Tragic 5.2% |
| Immigrants | Senegal | 0.1 /100 | #267 | Tragic 5.2% |
| Mexicans | 0.1 /100 | #268 | Tragic 5.2% |
| Tsimshian | 0.1 /100 | #269 | Tragic 5.2% |
| Ute | 0.1 /100 | #270 | Tragic 5.2% |
| Cree | 0.1 /100 | #271 | Tragic 5.2% |
| Immigrants | Jamaica | 0.0 /100 | #272 | Tragic 5.2% |
| Ottawa | 0.0 /100 | #273 | Tragic 5.2% |
| Mexican American Indians | 0.0 /100 | #274 | Tragic 5.2% |
| Israelis | 0.0 /100 | #275 | Tragic 5.2% |
| West Indians | 0.0 /100 | #276 | Tragic 5.2% |
| Immigrants | Latin America | 0.0 /100 | #277 | Tragic 5.2% |
| Immigrants | Barbados | 0.0 /100 | #278 | Tragic 5.2% |
| Alsatians | 0.0 /100 | #279 | Tragic 5.2% |
| Immigrants | Uzbekistan | 0.0 /100 | #280 | Tragic 5.3% |
Demographics Similar to Serbians by Unemployment Among Ages 55 to 59 years
In terms of unemployment among ages 55 to 59 years, the demographic groups most similar to Serbians are Celtic (4.7%, a difference of 0.010%), Canadian (4.7%, a difference of 0.060%), Immigrants from Oceania (4.7%, a difference of 0.060%), Yugoslavian (4.7%, a difference of 0.070%), and Immigrants from Turkey (4.7%, a difference of 0.080%).
| Demographics | Rating | Rank | Unemployment Among Ages 55 to 59 years |
| Immigrants | England | 95.8 /100 | #93 | Exceptional 4.7% |
| Immigrants | Scotland | 95.7 /100 | #94 | Exceptional 4.7% |
| South Africans | 95.6 /100 | #95 | Exceptional 4.7% |
| Immigrants | Belgium | 95.0 /100 | #96 | Exceptional 4.7% |
| Immigrants | Canada | 94.9 /100 | #97 | Exceptional 4.7% |
| Immigrants | Germany | 94.8 /100 | #98 | Exceptional 4.7% |
| Yugoslavians | 94.7 /100 | #99 | Exceptional 4.7% |
| Serbians | 94.4 /100 | #100 | Exceptional 4.7% |
| Celtics | 94.3 /100 | #101 | Exceptional 4.7% |
| Canadians | 94.1 /100 | #102 | Exceptional 4.7% |
| Immigrants | Oceania | 94.0 /100 | #103 | Exceptional 4.7% |
| Immigrants | Turkey | 93.9 /100 | #104 | Exceptional 4.7% |
| Immigrants | North America | 93.9 /100 | #105 | Exceptional 4.7% |
| Immigrants | Laos | 93.9 /100 | #106 | Exceptional 4.7% |
| Immigrants | Egypt | 93.5 /100 | #107 | Exceptional 4.7% |