Okinawan vs Turkish Family Households with Children
COMPARE
Okinawan
Turkish
Family Households with Children
Family Households with Children Comparison
Okinawans
Turks
27.2%
FAMILY HOUSEHOLDS WITH CHILDREN
13.7/ 100
METRIC RATING
213th/ 347
METRIC RANK
27.4%
FAMILY HOUSEHOLDS WITH CHILDREN
46.9/ 100
METRIC RATING
179th/ 347
METRIC RANK
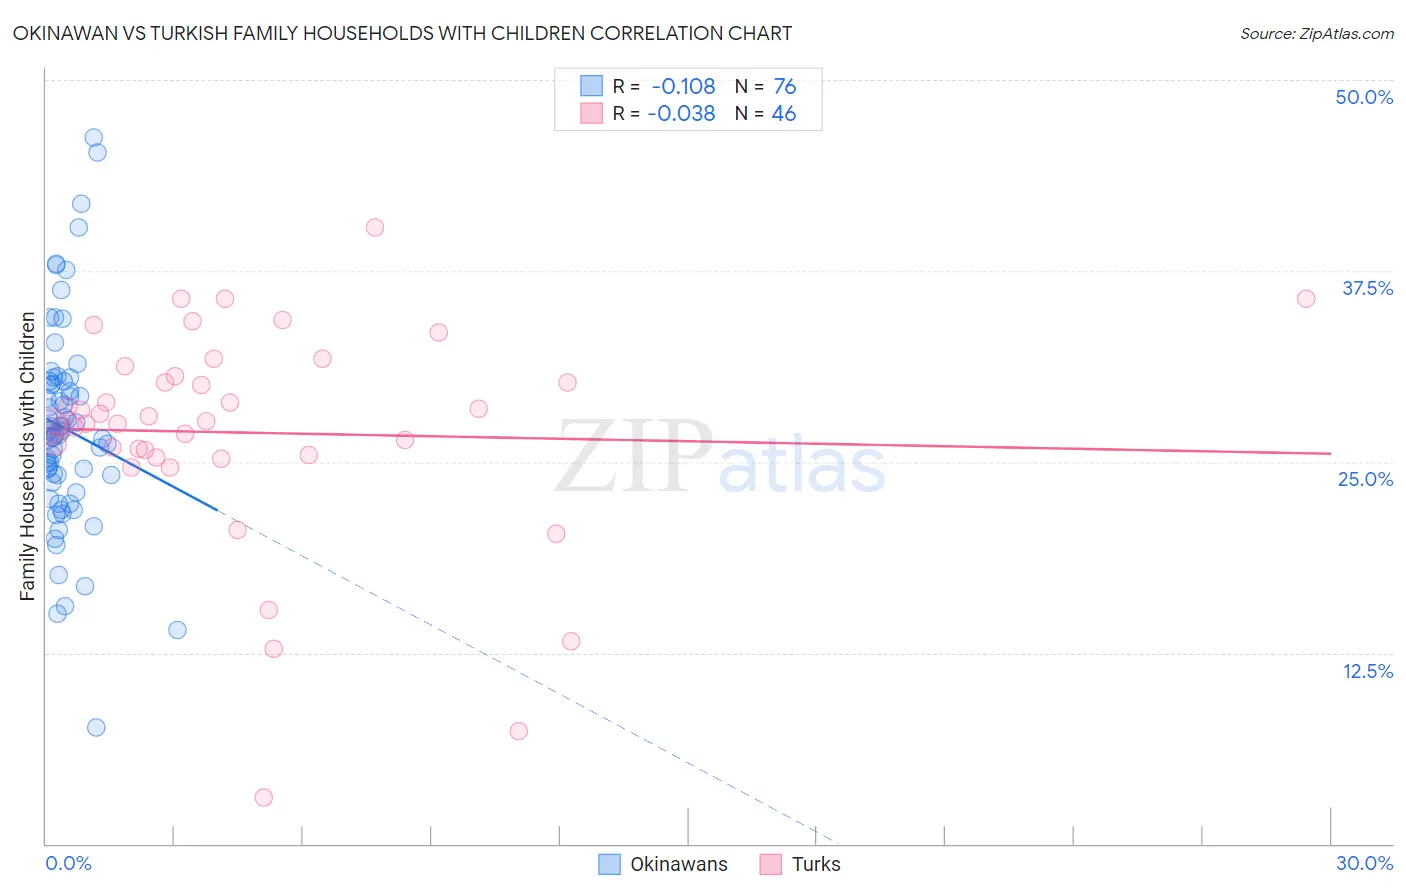
Okinawan vs Turkish Family Households with Children Correlation Chart
The statistical analysis conducted on geographies consisting of 73,692,255 people shows a poor negative correlation between the proportion of Okinawans and percentage of family households with children in the United States with a correlation coefficient (R) of -0.108 and weighted average of 27.2%. Similarly, the statistical analysis conducted on geographies consisting of 271,630,729 people shows no correlation between the proportion of Turks and percentage of family households with children in the United States with a correlation coefficient (R) of -0.038 and weighted average of 27.4%, a difference of 0.95%.
Family Households with Children Correlation Summary
| Measurement | Okinawan | Turkish |
| Minimum | 7.6% | 3.0% |
| Maximum | 46.3% | 40.4% |
| Range | 38.7% | 37.3% |
| Mean | 27.2% | 26.9% |
| Median | 26.9% | 27.6% |
| Interquartile 25% (IQ1) | 23.9% | 25.4% |
| Interquartile 75% (IQ3) | 30.2% | 30.6% |
| Interquartile Range (IQR) | 6.3% | 5.2% |
| Standard Deviation (Sample) | 6.7% | 7.2% |
| Standard Deviation (Population) | 6.6% | 7.1% |
Similar Demographics by Family Households with Children
Demographics Similar to Okinawans by Family Households with Children
In terms of family households with children, the demographic groups most similar to Okinawans are Immigrants from Dominica (27.2%, a difference of 0.010%), Welsh (27.2%, a difference of 0.020%), Immigrants from Ukraine (27.2%, a difference of 0.030%), African (27.2%, a difference of 0.040%), and Northern European (27.2%, a difference of 0.040%).
| Demographics | Rating | Rank | Family Households with Children |
| Immigrants | Micronesia | 20.2 /100 | #206 | Fair 27.2% |
| Haitians | 19.8 /100 | #207 | Poor 27.2% |
| Immigrants | Poland | 16.4 /100 | #208 | Poor 27.2% |
| Dutch West Indians | 15.8 /100 | #209 | Poor 27.2% |
| Immigrants | Ukraine | 14.4 /100 | #210 | Poor 27.2% |
| Welsh | 14.2 /100 | #211 | Poor 27.2% |
| Immigrants | Dominica | 13.9 /100 | #212 | Poor 27.2% |
| Okinawans | 13.7 /100 | #213 | Poor 27.2% |
| Africans | 13.0 /100 | #214 | Poor 27.2% |
| Northern Europeans | 12.8 /100 | #215 | Poor 27.2% |
| Cubans | 12.2 /100 | #216 | Poor 27.1% |
| U.S. Virgin Islanders | 12.1 /100 | #217 | Poor 27.1% |
| Greeks | 11.4 /100 | #218 | Poor 27.1% |
| Immigrants | Japan | 10.7 /100 | #219 | Poor 27.1% |
| Austrians | 9.9 /100 | #220 | Tragic 27.1% |
Demographics Similar to Turks by Family Households with Children
In terms of family households with children, the demographic groups most similar to Turks are Immigrants from Turkey (27.4%, a difference of 0.0%), Aleut (27.4%, a difference of 0.0%), Puget Sound Salish (27.4%, a difference of 0.020%), Spanish American (27.4%, a difference of 0.040%), and Ugandan (27.4%, a difference of 0.050%).
| Demographics | Rating | Rank | Family Households with Children |
| Israelis | 53.9 /100 | #172 | Average 27.5% |
| Immigrants | Argentina | 52.2 /100 | #173 | Average 27.5% |
| Whites/Caucasians | 50.0 /100 | #174 | Average 27.4% |
| British | 49.9 /100 | #175 | Average 27.4% |
| Immigrants | China | 49.6 /100 | #176 | Average 27.4% |
| Ugandans | 49.2 /100 | #177 | Average 27.4% |
| Spanish Americans | 48.9 /100 | #178 | Average 27.4% |
| Turks | 46.9 /100 | #179 | Average 27.4% |
| Immigrants | Turkey | 46.9 /100 | #180 | Average 27.4% |
| Aleuts | 46.7 /100 | #181 | Average 27.4% |
| Puget Sound Salish | 46.2 /100 | #182 | Average 27.4% |
| South Africans | 44.9 /100 | #183 | Average 27.4% |
| Native Hawaiians | 44.6 /100 | #184 | Average 27.4% |
| Delaware | 42.0 /100 | #185 | Average 27.4% |
| Immigrants | Brazil | 40.6 /100 | #186 | Average 27.4% |