Okinawan vs Turkish Unemployment Among Ages 20 to 24 years
COMPARE
Okinawan
Turkish
Unemployment Among Ages 20 to 24 years
Unemployment Among Ages 20 to 24 years Comparison
Okinawans
Turks
10.3%
UNEMPLOYMENT AMONG AGES 20 TO 24 YEARS
39.1/ 100
METRIC RATING
181st/ 347
METRIC RANK
10.3%
UNEMPLOYMENT AMONG AGES 20 TO 24 YEARS
55.2/ 100
METRIC RATING
170th/ 347
METRIC RANK
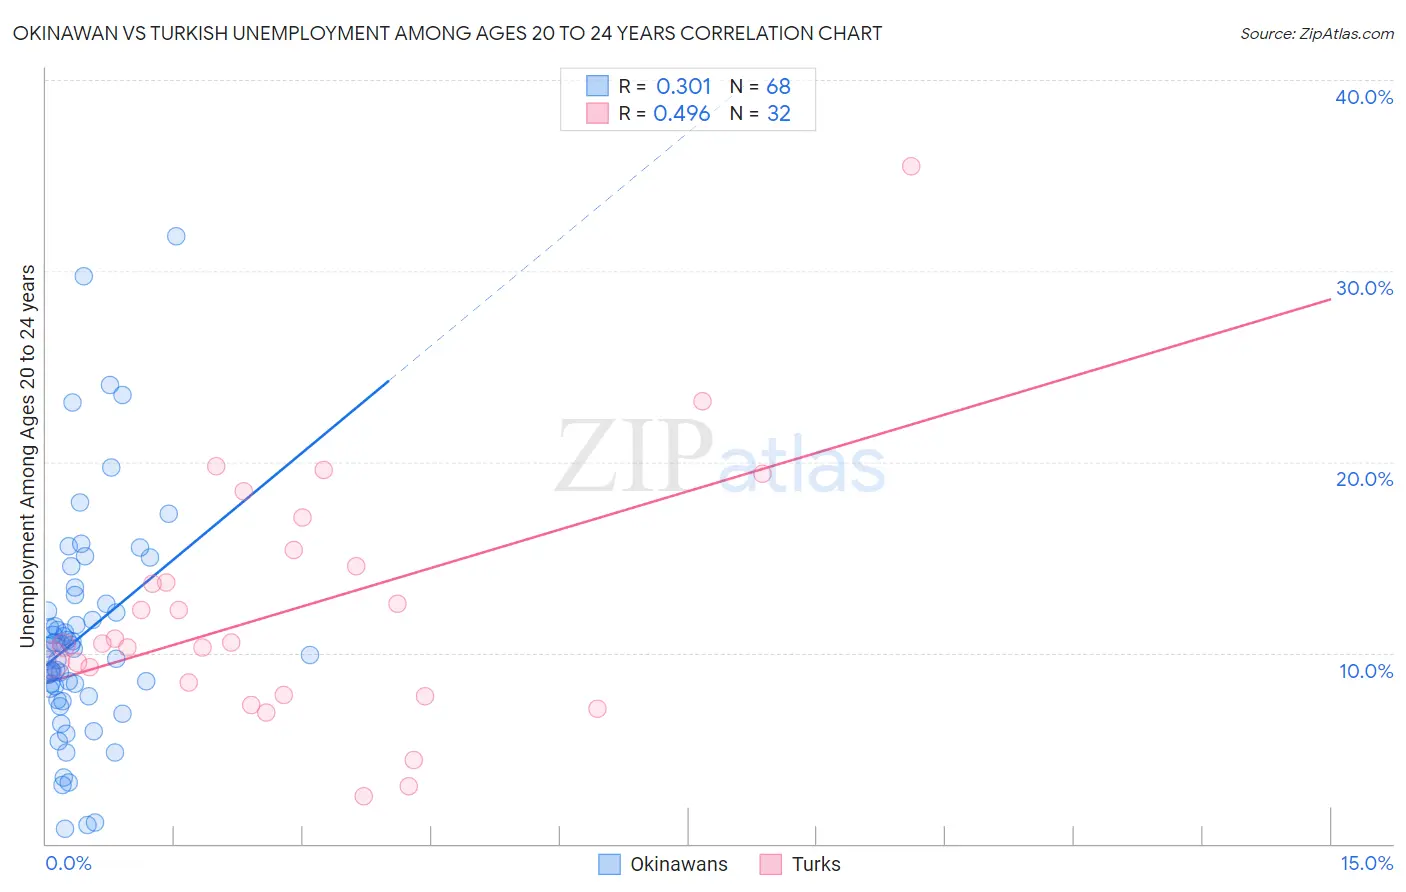
Okinawan vs Turkish Unemployment Among Ages 20 to 24 years Correlation Chart
The statistical analysis conducted on geographies consisting of 73,497,912 people shows a mild positive correlation between the proportion of Okinawans and unemployment rate among population between the ages 20 and 24 in the United States with a correlation coefficient (R) of 0.301 and weighted average of 10.3%. Similarly, the statistical analysis conducted on geographies consisting of 266,774,414 people shows a moderate positive correlation between the proportion of Turks and unemployment rate among population between the ages 20 and 24 in the United States with a correlation coefficient (R) of 0.496 and weighted average of 10.3%, a difference of 0.60%.
Unemployment Among Ages 20 to 24 years Correlation Summary
| Measurement | Okinawan | Turkish |
| Minimum | 0.80% | 2.5% |
| Maximum | 31.8% | 35.5% |
| Range | 31.0% | 33.0% |
| Mean | 10.9% | 12.3% |
| Median | 10.2% | 10.5% |
| Interquartile 25% (IQ1) | 7.9% | 8.1% |
| Interquartile 75% (IQ3) | 12.4% | 15.0% |
| Interquartile Range (IQR) | 4.5% | 6.8% |
| Standard Deviation (Sample) | 5.9% | 6.5% |
| Standard Deviation (Population) | 5.9% | 6.4% |
Demographics Similar to Okinawans and Turks by Unemployment Among Ages 20 to 24 years
In terms of unemployment among ages 20 to 24 years, the demographic groups most similar to Okinawans are Immigrants from Turkey (10.3%, a difference of 0.010%), Tlingit-Haida (10.3%, a difference of 0.020%), Immigrants from Germany (10.4%, a difference of 0.040%), Alsatian (10.3%, a difference of 0.050%), and Immigrants from Egypt (10.4%, a difference of 0.060%). Similarly, the demographic groups most similar to Turks are Immigrants from Colombia (10.3%, a difference of 0.040%), Iraqi (10.3%, a difference of 0.060%), Immigrants from Fiji (10.3%, a difference of 0.090%), Immigrants from Eastern Asia (10.3%, a difference of 0.090%), and Italian (10.3%, a difference of 0.10%).
| Demographics | Rating | Rank | Unemployment Among Ages 20 to 24 years |
| Lebanese | 58.3 /100 | #165 | Average 10.3% |
| Italians | 57.7 /100 | #166 | Average 10.3% |
| Immigrants | Fiji | 57.6 /100 | #167 | Average 10.3% |
| Iraqis | 56.7 /100 | #168 | Average 10.3% |
| Immigrants | Colombia | 56.3 /100 | #169 | Average 10.3% |
| Turks | 55.2 /100 | #170 | Average 10.3% |
| Immigrants | Eastern Asia | 52.7 /100 | #171 | Average 10.3% |
| Koreans | 51.9 /100 | #172 | Average 10.3% |
| Immigrants | Sweden | 50.8 /100 | #173 | Average 10.3% |
| Ukrainians | 50.0 /100 | #174 | Average 10.3% |
| Samoans | 45.4 /100 | #175 | Average 10.3% |
| Potawatomi | 42.0 /100 | #176 | Average 10.3% |
| Immigrants | Czechoslovakia | 40.8 /100 | #177 | Average 10.3% |
| Alsatians | 40.5 /100 | #178 | Average 10.3% |
| Tlingit-Haida | 39.7 /100 | #179 | Fair 10.3% |
| Immigrants | Turkey | 39.3 /100 | #180 | Fair 10.3% |
| Okinawans | 39.1 /100 | #181 | Fair 10.3% |
| Immigrants | Germany | 38.1 /100 | #182 | Fair 10.4% |
| Immigrants | Egypt | 37.4 /100 | #183 | Fair 10.4% |
| Greeks | 37.2 /100 | #184 | Fair 10.4% |
| Syrians | 35.6 /100 | #185 | Fair 10.4% |