Filipino vs Turkish Family Households with Children
COMPARE
Filipino
Turkish
Family Households with Children
Family Households with Children Comparison
Filipinos
Turks
28.6%
FAMILY HOUSEHOLDS WITH CHILDREN
99.9/ 100
METRIC RATING
64th/ 347
METRIC RANK
27.4%
FAMILY HOUSEHOLDS WITH CHILDREN
46.9/ 100
METRIC RATING
179th/ 347
METRIC RANK
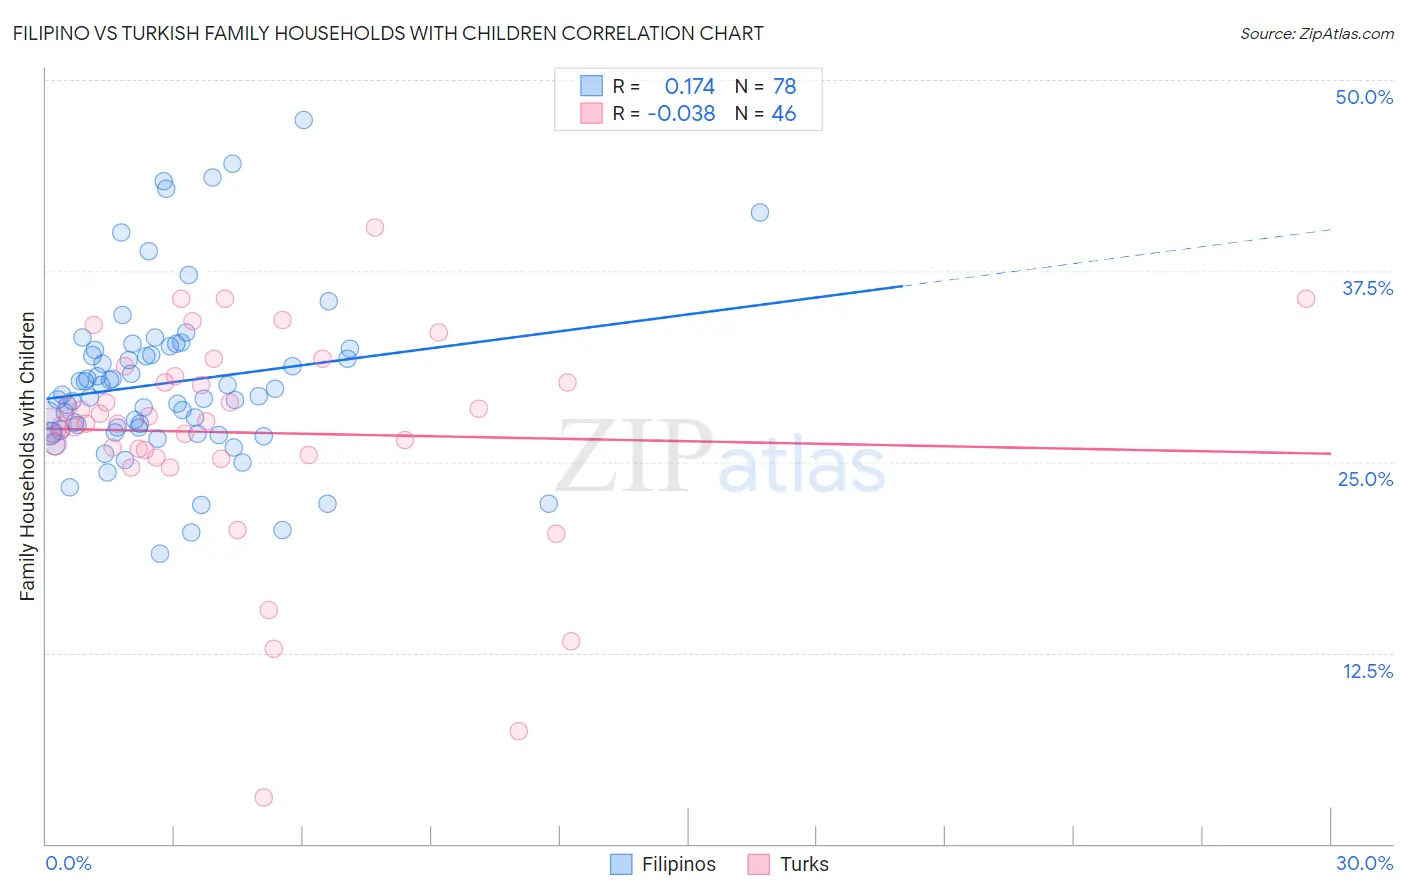
Filipino vs Turkish Family Households with Children Correlation Chart
The statistical analysis conducted on geographies consisting of 254,080,419 people shows a poor positive correlation between the proportion of Filipinos and percentage of family households with children in the United States with a correlation coefficient (R) of 0.174 and weighted average of 28.6%. Similarly, the statistical analysis conducted on geographies consisting of 271,630,729 people shows no correlation between the proportion of Turks and percentage of family households with children in the United States with a correlation coefficient (R) of -0.038 and weighted average of 27.4%, a difference of 4.1%.
Family Households with Children Correlation Summary
| Measurement | Filipino | Turkish |
| Minimum | 19.0% | 3.0% |
| Maximum | 47.3% | 40.4% |
| Range | 28.4% | 37.3% |
| Mean | 30.2% | 26.9% |
| Median | 29.3% | 27.6% |
| Interquartile 25% (IQ1) | 26.9% | 25.4% |
| Interquartile 75% (IQ3) | 32.4% | 30.6% |
| Interquartile Range (IQR) | 5.4% | 5.2% |
| Standard Deviation (Sample) | 5.5% | 7.2% |
| Standard Deviation (Population) | 5.5% | 7.1% |
Similar Demographics by Family Households with Children
Demographics Similar to Filipinos by Family Households with Children
In terms of family households with children, the demographic groups most similar to Filipinos are Immigrants from Lebanon (28.6%, a difference of 0.070%), Immigrants from Ghana (28.6%, a difference of 0.080%), Egyptian (28.6%, a difference of 0.080%), Honduran (28.5%, a difference of 0.080%), and Immigrants from Egypt (28.5%, a difference of 0.080%).
| Demographics | Rating | Rank | Family Households with Children |
| Danes | 100.0 /100 | #57 | Exceptional 28.7% |
| Hawaiians | 100.0 /100 | #58 | Exceptional 28.7% |
| Immigrants | Nigeria | 100.0 /100 | #59 | Exceptional 28.6% |
| Hmong | 99.9 /100 | #60 | Exceptional 28.6% |
| Immigrants | Ghana | 99.9 /100 | #61 | Exceptional 28.6% |
| Egyptians | 99.9 /100 | #62 | Exceptional 28.6% |
| Immigrants | Lebanon | 99.9 /100 | #63 | Exceptional 28.6% |
| Filipinos | 99.9 /100 | #64 | Exceptional 28.6% |
| Hondurans | 99.9 /100 | #65 | Exceptional 28.5% |
| Immigrants | Egypt | 99.9 /100 | #66 | Exceptional 28.5% |
| Ghanaians | 99.9 /100 | #67 | Exceptional 28.5% |
| Houma | 99.9 /100 | #68 | Exceptional 28.5% |
| Immigrants | Korea | 99.9 /100 | #69 | Exceptional 28.5% |
| Immigrants | Honduras | 99.9 /100 | #70 | Exceptional 28.5% |
| Burmese | 99.9 /100 | #71 | Exceptional 28.5% |
Demographics Similar to Turks by Family Households with Children
In terms of family households with children, the demographic groups most similar to Turks are Immigrants from Turkey (27.4%, a difference of 0.0%), Aleut (27.4%, a difference of 0.0%), Puget Sound Salish (27.4%, a difference of 0.020%), Spanish American (27.4%, a difference of 0.040%), and Ugandan (27.4%, a difference of 0.050%).
| Demographics | Rating | Rank | Family Households with Children |
| Israelis | 53.9 /100 | #172 | Average 27.5% |
| Immigrants | Argentina | 52.2 /100 | #173 | Average 27.5% |
| Whites/Caucasians | 50.0 /100 | #174 | Average 27.4% |
| British | 49.9 /100 | #175 | Average 27.4% |
| Immigrants | China | 49.6 /100 | #176 | Average 27.4% |
| Ugandans | 49.2 /100 | #177 | Average 27.4% |
| Spanish Americans | 48.9 /100 | #178 | Average 27.4% |
| Turks | 46.9 /100 | #179 | Average 27.4% |
| Immigrants | Turkey | 46.9 /100 | #180 | Average 27.4% |
| Aleuts | 46.7 /100 | #181 | Average 27.4% |
| Puget Sound Salish | 46.2 /100 | #182 | Average 27.4% |
| South Africans | 44.9 /100 | #183 | Average 27.4% |
| Native Hawaiians | 44.6 /100 | #184 | Average 27.4% |
| Delaware | 42.0 /100 | #185 | Average 27.4% |
| Immigrants | Brazil | 40.6 /100 | #186 | Average 27.4% |