Nonimmigrants vs Sudanese Unemployment Among Ages 25 to 29 years
COMPARE
Nonimmigrants
Sudanese
Unemployment Among Ages 25 to 29 years
Unemployment Among Ages 25 to 29 years Comparison
Nonimmigrants
Sudanese
7.1%
UNEMPLOYMENT AMONG AGES 25 TO 29 YEARS
0.9/ 100
METRIC RATING
244th/ 347
METRIC RANK
5.4%
UNEMPLOYMENT AMONG AGES 25 TO 29 YEARS
100.0/ 100
METRIC RATING
1st/ 347
METRIC RANK
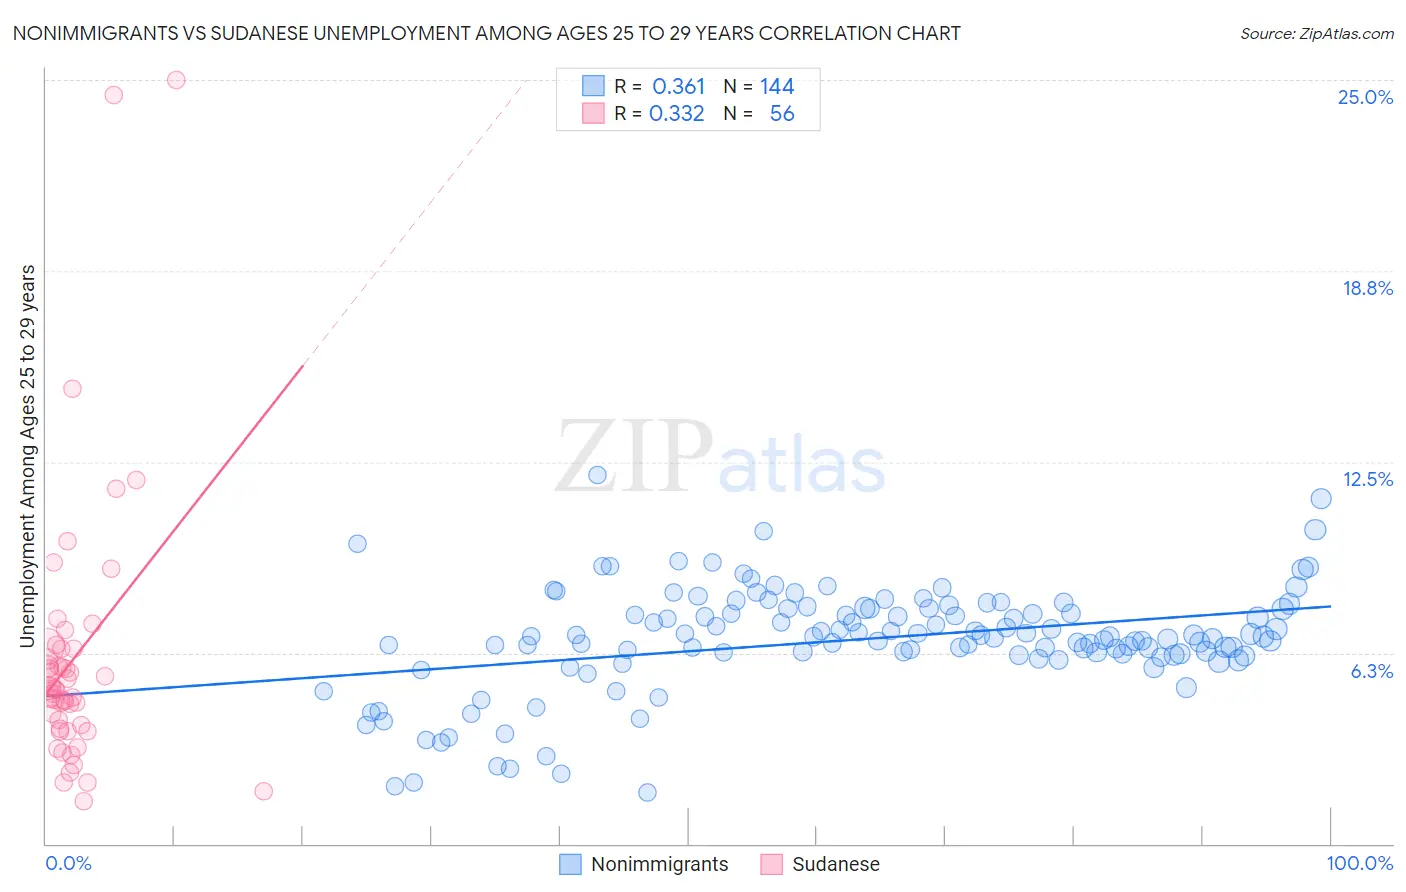
Nonimmigrants vs Sudanese Unemployment Among Ages 25 to 29 years Correlation Chart
The statistical analysis conducted on geographies consisting of 505,981,567 people shows a mild positive correlation between the proportion of Nonimmigrants and unemployment rate among population between the ages 25 and 29 in the United States with a correlation coefficient (R) of 0.361 and weighted average of 7.1%. Similarly, the statistical analysis conducted on geographies consisting of 108,696,537 people shows a mild positive correlation between the proportion of Sudanese and unemployment rate among population between the ages 25 and 29 in the United States with a correlation coefficient (R) of 0.332 and weighted average of 5.4%, a difference of 32.4%.
Unemployment Among Ages 25 to 29 years Correlation Summary
| Measurement | Nonimmigrants | Sudanese |
| Minimum | 1.7% | 1.4% |
| Maximum | 12.1% | 25.0% |
| Range | 10.4% | 23.6% |
| Mean | 6.7% | 6.1% |
| Median | 6.8% | 5.0% |
| Interquartile 25% (IQ1) | 6.2% | 3.8% |
| Interquartile 75% (IQ3) | 7.7% | 6.4% |
| Interquartile Range (IQR) | 1.5% | 2.6% |
| Standard Deviation (Sample) | 1.7% | 4.4% |
| Standard Deviation (Population) | 1.7% | 4.4% |
Similar Demographics by Unemployment Among Ages 25 to 29 years
Demographics Similar to Nonimmigrants by Unemployment Among Ages 25 to 29 years
In terms of unemployment among ages 25 to 29 years, the demographic groups most similar to Nonimmigrants are Yaqui (7.1%, a difference of 0.030%), Guatemalan (7.1%, a difference of 0.10%), Spanish American Indian (7.1%, a difference of 0.16%), Immigrants from Sierra Leone (7.1%, a difference of 0.43%), and Native Hawaiian (7.1%, a difference of 0.47%).
| Demographics | Rating | Rank | Unemployment Among Ages 25 to 29 years |
| Puget Sound Salish | 1.8 /100 | #237 | Tragic 7.1% |
| Hondurans | 1.8 /100 | #238 | Tragic 7.1% |
| Potawatomi | 1.3 /100 | #239 | Tragic 7.1% |
| Native Hawaiians | 1.3 /100 | #240 | Tragic 7.1% |
| Immigrants | Sierra Leone | 1.3 /100 | #241 | Tragic 7.1% |
| Spanish American Indians | 1.1 /100 | #242 | Tragic 7.1% |
| Yaqui | 1.0 /100 | #243 | Tragic 7.1% |
| Immigrants | Nonimmigrants | 0.9 /100 | #244 | Tragic 7.1% |
| Guatemalans | 0.9 /100 | #245 | Tragic 7.1% |
| Immigrants | Uzbekistan | 0.7 /100 | #246 | Tragic 7.2% |
| Immigrants | Guatemala | 0.7 /100 | #247 | Tragic 7.2% |
| Sub-Saharan Africans | 0.6 /100 | #248 | Tragic 7.2% |
| Seminole | 0.6 /100 | #249 | Tragic 7.2% |
| Delaware | 0.5 /100 | #250 | Tragic 7.2% |
| Portuguese | 0.5 /100 | #251 | Tragic 7.2% |
Demographics Similar to Sudanese by Unemployment Among Ages 25 to 29 years
In terms of unemployment among ages 25 to 29 years, the demographic groups most similar to Sudanese are Tongan (5.5%, a difference of 2.5%), Immigrants from Somalia (5.5%, a difference of 2.8%), Immigrants from Cuba (5.6%, a difference of 4.9%), Somali (5.6%, a difference of 5.0%), and Hmong (5.7%, a difference of 5.2%).
| Demographics | Rating | Rank | Unemployment Among Ages 25 to 29 years |
| Sudanese | 100.0 /100 | #1 | Exceptional 5.4% |
| Tongans | 100.0 /100 | #2 | Exceptional 5.5% |
| Immigrants | Somalia | 100.0 /100 | #3 | Exceptional 5.5% |
| Immigrants | Cuba | 100.0 /100 | #4 | Exceptional 5.6% |
| Somalis | 100.0 /100 | #5 | Exceptional 5.6% |
| Hmong | 100.0 /100 | #6 | Exceptional 5.7% |
| Immigrants | India | 100.0 /100 | #7 | Exceptional 5.7% |
| Immigrants | Bosnia and Herzegovina | 100.0 /100 | #8 | Exceptional 5.7% |
| Immigrants | Nepal | 100.0 /100 | #9 | Exceptional 5.7% |
| Immigrants | Sudan | 100.0 /100 | #10 | Exceptional 5.8% |
| Cambodians | 100.0 /100 | #11 | Exceptional 5.8% |
| Okinawans | 100.0 /100 | #12 | Exceptional 5.9% |
| Immigrants | Bolivia | 100.0 /100 | #13 | Exceptional 5.9% |
| Immigrants | Kuwait | 99.9 /100 | #14 | Exceptional 5.9% |
| Cubans | 99.9 /100 | #15 | Exceptional 5.9% |