New Zealander vs Yakama Family Households
COMPARE
New Zealander
Yakama
Family Households
Family Households Comparison
New Zealanders
Yakama
62.9%
FAMILY HOUSEHOLDS
0.1/ 100
METRIC RATING
282nd/ 347
METRIC RANK
69.3%
FAMILY HOUSEHOLDS
100.0/ 100
METRIC RATING
4th/ 347
METRIC RANK
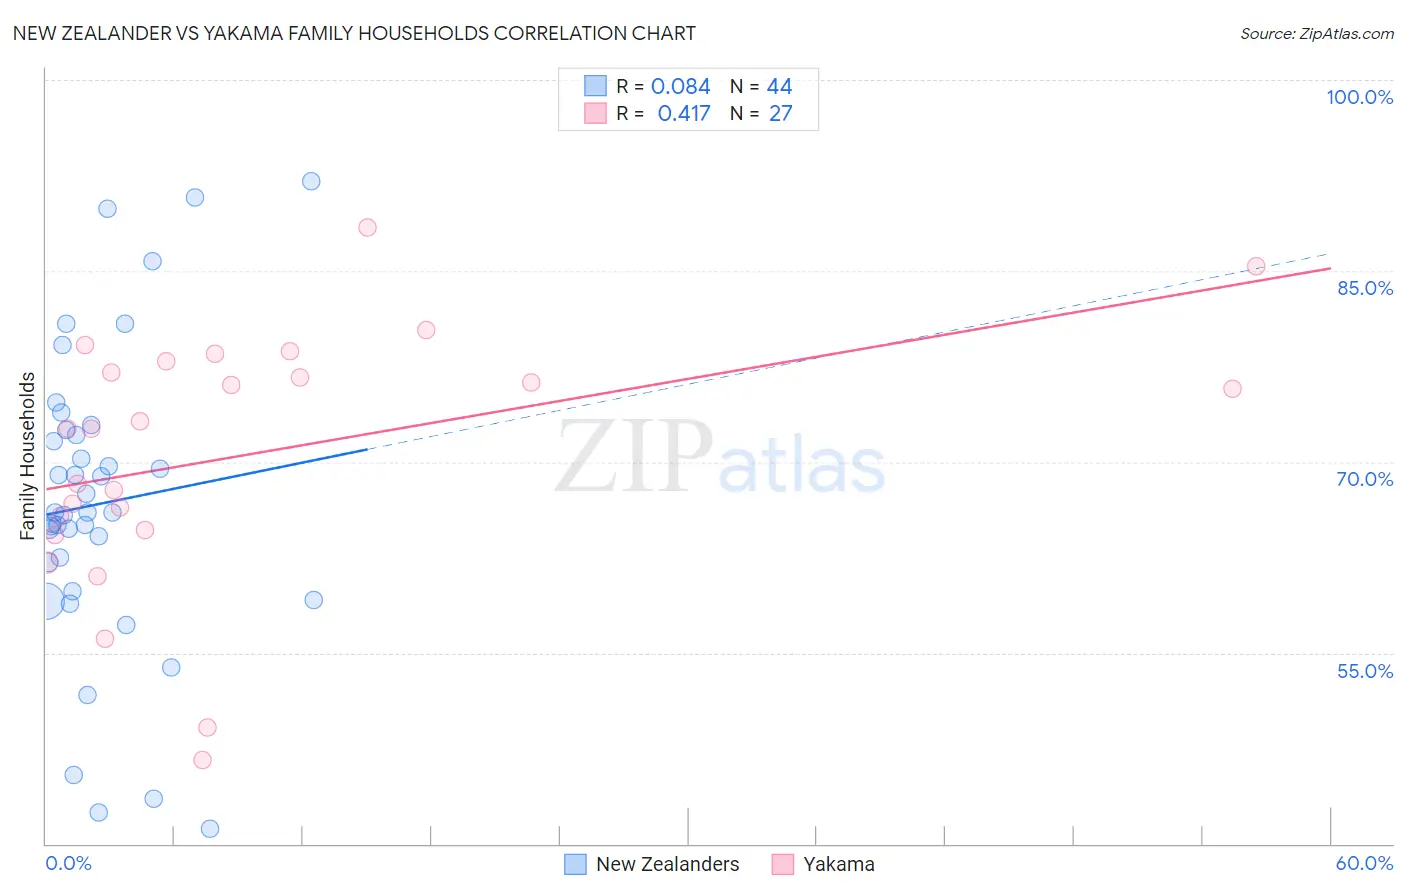
New Zealander vs Yakama Family Households Correlation Chart
The statistical analysis conducted on geographies consisting of 106,894,441 people shows a slight positive correlation between the proportion of New Zealanders and percentage of family households in the United States with a correlation coefficient (R) of 0.084 and weighted average of 62.9%. Similarly, the statistical analysis conducted on geographies consisting of 19,917,879 people shows a moderate positive correlation between the proportion of Yakama and percentage of family households in the United States with a correlation coefficient (R) of 0.417 and weighted average of 69.3%, a difference of 10.2%.
Family Households Correlation Summary
| Measurement | New Zealander | Yakama |
| Minimum | 41.2% | 46.6% |
| Maximum | 92.0% | 88.5% |
| Range | 50.8% | 41.9% |
| Mean | 66.7% | 70.6% |
| Median | 66.0% | 72.6% |
| Interquartile 25% (IQ1) | 60.9% | 64.6% |
| Interquartile 75% (IQ3) | 72.3% | 77.9% |
| Interquartile Range (IQR) | 11.4% | 13.3% |
| Standard Deviation (Sample) | 11.8% | 10.1% |
| Standard Deviation (Population) | 11.6% | 9.9% |
Similar Demographics by Family Households
Demographics Similar to New Zealanders by Family Households
In terms of family households, the demographic groups most similar to New Zealanders are Immigrants from Denmark (62.9%, a difference of 0.010%), Estonian (62.9%, a difference of 0.030%), Australian (62.8%, a difference of 0.050%), Immigrants from Bulgaria (63.0%, a difference of 0.13%), and Immigrants from Yemen (63.0%, a difference of 0.14%).
| Demographics | Rating | Rank | Family Households |
| West Indians | 0.3 /100 | #275 | Tragic 63.1% |
| Serbians | 0.3 /100 | #276 | Tragic 63.0% |
| Ottawa | 0.3 /100 | #277 | Tragic 63.0% |
| Immigrants | Belgium | 0.2 /100 | #278 | Tragic 63.0% |
| Immigrants | Yemen | 0.2 /100 | #279 | Tragic 63.0% |
| Immigrants | Bulgaria | 0.2 /100 | #280 | Tragic 63.0% |
| Estonians | 0.2 /100 | #281 | Tragic 62.9% |
| New Zealanders | 0.1 /100 | #282 | Tragic 62.9% |
| Immigrants | Denmark | 0.1 /100 | #283 | Tragic 62.9% |
| Australians | 0.1 /100 | #284 | Tragic 62.8% |
| Mongolians | 0.1 /100 | #285 | Tragic 62.8% |
| British West Indians | 0.1 /100 | #286 | Tragic 62.8% |
| Latvians | 0.1 /100 | #287 | Tragic 62.8% |
| Immigrants | Uganda | 0.1 /100 | #288 | Tragic 62.7% |
| Immigrants | Nepal | 0.1 /100 | #289 | Tragic 62.7% |
Demographics Similar to Yakama by Family Households
In terms of family households, the demographic groups most similar to Yakama are Yuman (69.3%, a difference of 0.030%), Immigrants from Mexico (69.1%, a difference of 0.26%), Tongan (69.6%, a difference of 0.44%), Mexican (69.0%, a difference of 0.47%), and Immigrants from Fiji (68.8%, a difference of 0.80%).
| Demographics | Rating | Rank | Family Households |
| Yup'ik | 100 /100 | #1 | Exceptional 72.4% |
| Spanish American Indians | 100.0 /100 | #2 | Exceptional 71.2% |
| Tongans | 100.0 /100 | #3 | Exceptional 69.6% |
| Yakama | 100.0 /100 | #4 | Exceptional 69.3% |
| Yuman | 100.0 /100 | #5 | Exceptional 69.3% |
| Immigrants | Mexico | 100.0 /100 | #6 | Exceptional 69.1% |
| Mexicans | 100.0 /100 | #7 | Exceptional 69.0% |
| Immigrants | Fiji | 100.0 /100 | #8 | Exceptional 68.8% |
| Native Hawaiians | 100.0 /100 | #9 | Exceptional 68.4% |
| Immigrants | Philippines | 100.0 /100 | #10 | Exceptional 68.3% |
| Immigrants | Central America | 100.0 /100 | #11 | Exceptional 68.3% |
| Koreans | 100.0 /100 | #12 | Exceptional 68.3% |
| Pueblo | 100.0 /100 | #13 | Exceptional 68.2% |
| Immigrants | Cuba | 100.0 /100 | #14 | Exceptional 68.2% |
| Assyrians/Chaldeans/Syriacs | 100.0 /100 | #15 | Exceptional 68.2% |