Navajo vs Immigrants from Pakistan Family Households with Children
COMPARE
Navajo
Immigrants from Pakistan
Family Households with Children
Family Households with Children Comparison
Navajo
Immigrants from Pakistan
26.9%
FAMILY HOUSEHOLDS WITH CHILDREN
3.2/ 100
METRIC RATING
241st/ 347
METRIC RANK
30.2%
FAMILY HOUSEHOLDS WITH CHILDREN
100.0/ 100
METRIC RATING
12th/ 347
METRIC RANK
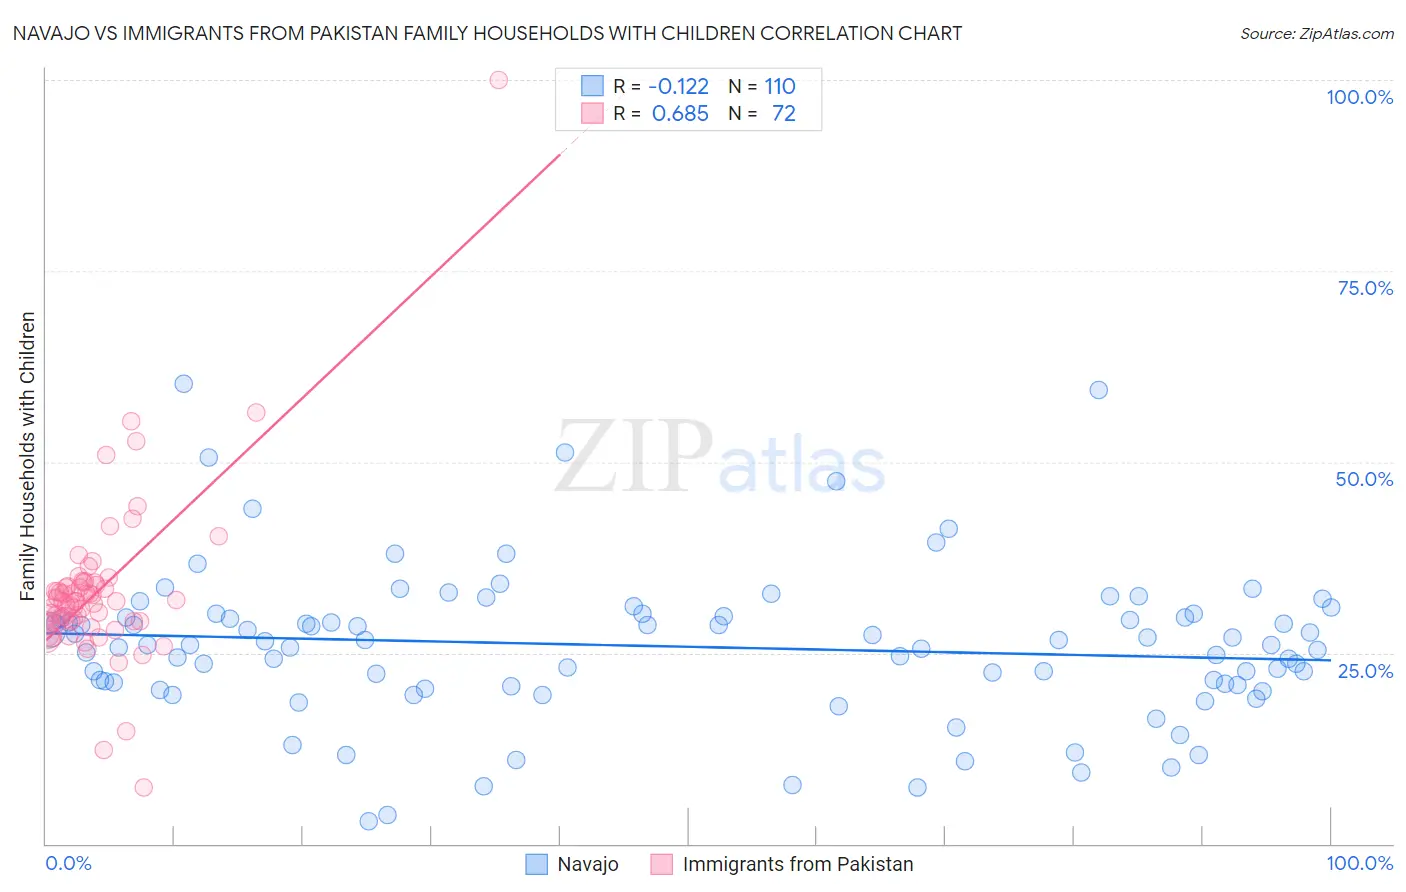
Navajo vs Immigrants from Pakistan Family Households with Children Correlation Chart
The statistical analysis conducted on geographies consisting of 224,710,255 people shows a poor negative correlation between the proportion of Navajo and percentage of family households with children in the United States with a correlation coefficient (R) of -0.122 and weighted average of 26.9%. Similarly, the statistical analysis conducted on geographies consisting of 283,710,080 people shows a significant positive correlation between the proportion of Immigrants from Pakistan and percentage of family households with children in the United States with a correlation coefficient (R) of 0.685 and weighted average of 30.2%, a difference of 12.3%.
Family Households with Children Correlation Summary
| Measurement | Navajo | Immigrants from Pakistan |
| Minimum | 2.9% | 7.4% |
| Maximum | 60.3% | 100.0% |
| Range | 57.4% | 92.6% |
| Mean | 25.9% | 33.0% |
| Median | 26.0% | 31.8% |
| Interquartile 25% (IQ1) | 20.8% | 29.1% |
| Interquartile 75% (IQ3) | 29.8% | 34.0% |
| Interquartile Range (IQR) | 8.9% | 4.9% |
| Standard Deviation (Sample) | 10.0% | 11.1% |
| Standard Deviation (Population) | 9.9% | 11.0% |
Similar Demographics by Family Households with Children
Demographics Similar to Navajo by Family Households with Children
In terms of family households with children, the demographic groups most similar to Navajo are Immigrants from England (26.9%, a difference of 0.0%), Immigrants from Bulgaria (26.9%, a difference of 0.010%), Immigrants from Southern Europe (26.9%, a difference of 0.020%), Moroccan (26.9%, a difference of 0.030%), and Immigrants from Netherlands (26.9%, a difference of 0.040%).
| Demographics | Rating | Rank | Family Households with Children |
| Immigrants | Germany | 4.4 /100 | #234 | Tragic 27.0% |
| Immigrants | Morocco | 4.2 /100 | #235 | Tragic 27.0% |
| Cape Verdeans | 3.6 /100 | #236 | Tragic 26.9% |
| Immigrants | Netherlands | 3.5 /100 | #237 | Tragic 26.9% |
| Moroccans | 3.4 /100 | #238 | Tragic 26.9% |
| Immigrants | Southern Europe | 3.4 /100 | #239 | Tragic 26.9% |
| Immigrants | Bulgaria | 3.3 /100 | #240 | Tragic 26.9% |
| Navajo | 3.2 /100 | #241 | Tragic 26.9% |
| Immigrants | England | 3.2 /100 | #242 | Tragic 26.9% |
| Immigrants | Saudi Arabia | 2.9 /100 | #243 | Tragic 26.9% |
| Ukrainians | 2.9 /100 | #244 | Tragic 26.9% |
| Australians | 2.8 /100 | #245 | Tragic 26.9% |
| Jamaicans | 2.5 /100 | #246 | Tragic 26.9% |
| Potawatomi | 2.2 /100 | #247 | Tragic 26.9% |
| Immigrants | Kazakhstan | 2.2 /100 | #248 | Tragic 26.9% |
Demographics Similar to Immigrants from Pakistan by Family Households with Children
In terms of family households with children, the demographic groups most similar to Immigrants from Pakistan are Afghan (30.2%, a difference of 0.24%), Bangladeshi (30.1%, a difference of 0.52%), Immigrants from South Central Asia (30.0%, a difference of 0.69%), Immigrants from Afghanistan (30.0%, a difference of 0.72%), and Nepalese (30.5%, a difference of 0.88%).
| Demographics | Rating | Rank | Family Households with Children |
| Tongans | 100.0 /100 | #5 | Exceptional 31.2% |
| Immigrants | India | 100.0 /100 | #6 | Exceptional 31.0% |
| Immigrants | Central America | 100.0 /100 | #7 | Exceptional 31.0% |
| Yakama | 100.0 /100 | #8 | Exceptional 30.8% |
| Thais | 100.0 /100 | #9 | Exceptional 30.6% |
| Immigrants | Fiji | 100.0 /100 | #10 | Exceptional 30.5% |
| Nepalese | 100.0 /100 | #11 | Exceptional 30.5% |
| Immigrants | Pakistan | 100.0 /100 | #12 | Exceptional 30.2% |
| Afghans | 100.0 /100 | #13 | Exceptional 30.2% |
| Bangladeshis | 100.0 /100 | #14 | Exceptional 30.1% |
| Immigrants | South Central Asia | 100.0 /100 | #15 | Exceptional 30.0% |
| Immigrants | Afghanistan | 100.0 /100 | #16 | Exceptional 30.0% |
| Hispanics or Latinos | 100.0 /100 | #17 | Exceptional 29.9% |
| Salvadorans | 100.0 /100 | #18 | Exceptional 29.9% |
| Alaska Natives | 100.0 /100 | #19 | Exceptional 29.9% |