Afghan vs Immigrants from Pakistan Family Households with Children
COMPARE
Afghan
Immigrants from Pakistan
Family Households with Children
Family Households with Children Comparison
Afghans
Immigrants from Pakistan
30.2%
FAMILY HOUSEHOLDS WITH CHILDREN
100.0/ 100
METRIC RATING
13th/ 347
METRIC RANK
30.2%
FAMILY HOUSEHOLDS WITH CHILDREN
100.0/ 100
METRIC RATING
12th/ 347
METRIC RANK
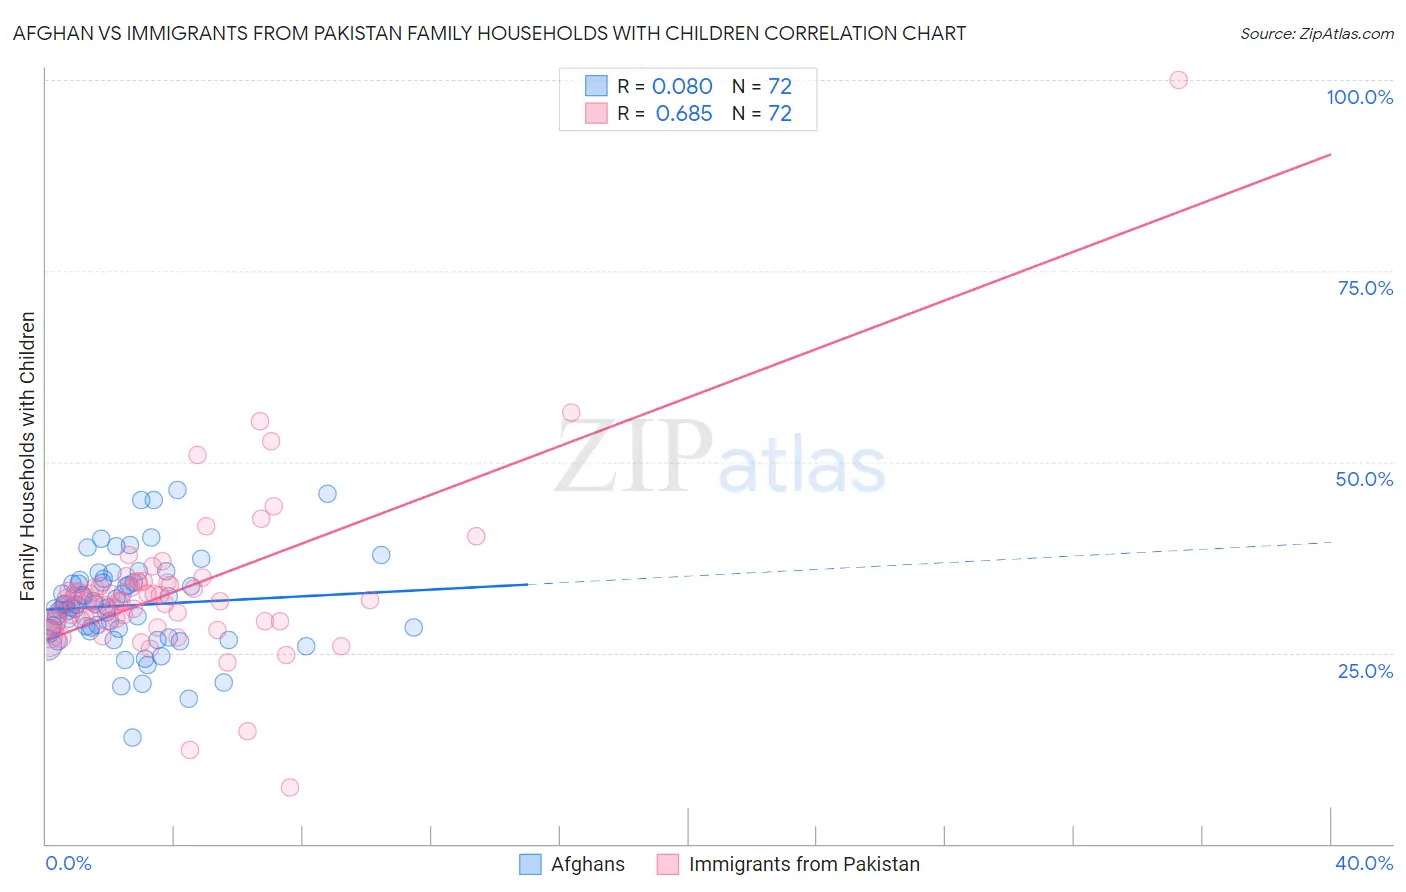
Afghan vs Immigrants from Pakistan Family Households with Children Correlation Chart
The statistical analysis conducted on geographies consisting of 148,820,145 people shows a slight positive correlation between the proportion of Afghans and percentage of family households with children in the United States with a correlation coefficient (R) of 0.080 and weighted average of 30.2%. Similarly, the statistical analysis conducted on geographies consisting of 283,710,080 people shows a significant positive correlation between the proportion of Immigrants from Pakistan and percentage of family households with children in the United States with a correlation coefficient (R) of 0.685 and weighted average of 30.2%, a difference of 0.24%.
Family Households with Children Correlation Summary
| Measurement | Afghan | Immigrants from Pakistan |
| Minimum | 13.8% | 7.4% |
| Maximum | 46.4% | 100.0% |
| Range | 32.5% | 92.6% |
| Mean | 31.2% | 33.0% |
| Median | 31.0% | 31.8% |
| Interquartile 25% (IQ1) | 27.8% | 29.1% |
| Interquartile 75% (IQ3) | 34.2% | 34.0% |
| Interquartile Range (IQR) | 6.4% | 4.9% |
| Standard Deviation (Sample) | 6.1% | 11.1% |
| Standard Deviation (Population) | 6.1% | 11.0% |
Demographics Similar to Afghans and Immigrants from Pakistan by Family Households with Children
In terms of family households with children, the demographic groups most similar to Afghans are Bangladeshi (30.1%, a difference of 0.28%), Immigrants from South Central Asia (30.0%, a difference of 0.46%), Immigrants from Afghanistan (30.0%, a difference of 0.48%), Hispanic or Latino (29.9%, a difference of 0.87%), and Salvadoran (29.9%, a difference of 1.1%). Similarly, the demographic groups most similar to Immigrants from Pakistan are Bangladeshi (30.1%, a difference of 0.52%), Immigrants from South Central Asia (30.0%, a difference of 0.69%), Immigrants from Afghanistan (30.0%, a difference of 0.72%), Nepalese (30.5%, a difference of 0.88%), and Immigrants from Fiji (30.5%, a difference of 0.96%).
| Demographics | Rating | Rank | Family Households with Children |
| Inupiat | 100 /100 | #2 | Exceptional 32.8% |
| Immigrants | Mexico | 100.0 /100 | #3 | Exceptional 31.6% |
| Mexicans | 100.0 /100 | #4 | Exceptional 31.4% |
| Tongans | 100.0 /100 | #5 | Exceptional 31.2% |
| Immigrants | India | 100.0 /100 | #6 | Exceptional 31.0% |
| Immigrants | Central America | 100.0 /100 | #7 | Exceptional 31.0% |
| Yakama | 100.0 /100 | #8 | Exceptional 30.8% |
| Thais | 100.0 /100 | #9 | Exceptional 30.6% |
| Immigrants | Fiji | 100.0 /100 | #10 | Exceptional 30.5% |
| Nepalese | 100.0 /100 | #11 | Exceptional 30.5% |
| Immigrants | Pakistan | 100.0 /100 | #12 | Exceptional 30.2% |
| Afghans | 100.0 /100 | #13 | Exceptional 30.2% |
| Bangladeshis | 100.0 /100 | #14 | Exceptional 30.1% |
| Immigrants | South Central Asia | 100.0 /100 | #15 | Exceptional 30.0% |
| Immigrants | Afghanistan | 100.0 /100 | #16 | Exceptional 30.0% |
| Hispanics or Latinos | 100.0 /100 | #17 | Exceptional 29.9% |
| Salvadorans | 100.0 /100 | #18 | Exceptional 29.9% |
| Alaska Natives | 100.0 /100 | #19 | Exceptional 29.9% |
| Immigrants | El Salvador | 100.0 /100 | #20 | Exceptional 29.8% |
| Immigrants | Laos | 100.0 /100 | #21 | Exceptional 29.8% |
| Malaysians | 100.0 /100 | #22 | Exceptional 29.8% |