Mexican American Indian vs Immigrants from Eastern Africa Family Households with Children
COMPARE
Mexican American Indian
Immigrants from Eastern Africa
Family Households with Children
Family Households with Children Comparison
Mexican American Indians
Immigrants from Eastern Africa
29.7%
FAMILY HOUSEHOLDS WITH CHILDREN
100.0/ 100
METRIC RATING
23rd/ 347
METRIC RANK
27.7%
FAMILY HOUSEHOLDS WITH CHILDREN
80.2/ 100
METRIC RATING
143rd/ 347
METRIC RANK
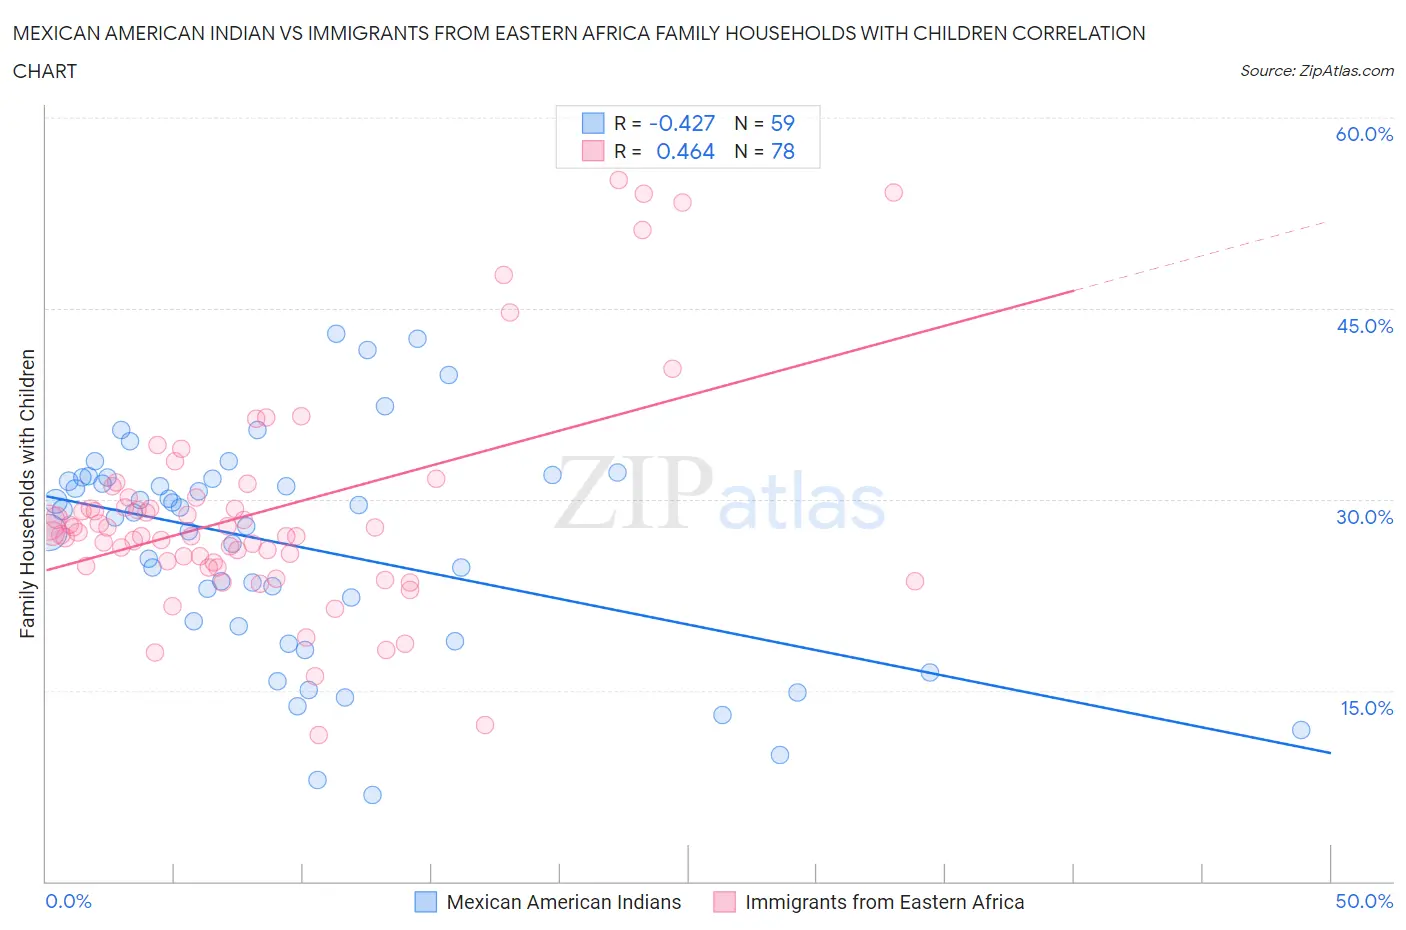
Mexican American Indian vs Immigrants from Eastern Africa Family Households with Children Correlation Chart
The statistical analysis conducted on geographies consisting of 317,453,959 people shows a moderate negative correlation between the proportion of Mexican American Indians and percentage of family households with children in the United States with a correlation coefficient (R) of -0.427 and weighted average of 29.7%. Similarly, the statistical analysis conducted on geographies consisting of 354,810,617 people shows a moderate positive correlation between the proportion of Immigrants from Eastern Africa and percentage of family households with children in the United States with a correlation coefficient (R) of 0.464 and weighted average of 27.7%, a difference of 7.5%.
Family Households with Children Correlation Summary
| Measurement | Mexican American Indian | Immigrants from Eastern Africa |
| Minimum | 6.8% | 11.5% |
| Maximum | 43.0% | 55.1% |
| Range | 36.2% | 43.6% |
| Mean | 26.3% | 29.0% |
| Median | 29.0% | 27.3% |
| Interquartile 25% (IQ1) | 20.1% | 25.0% |
| Interquartile 75% (IQ3) | 31.7% | 30.1% |
| Interquartile Range (IQR) | 11.7% | 5.1% |
| Standard Deviation (Sample) | 8.6% | 8.6% |
| Standard Deviation (Population) | 8.5% | 8.6% |
Similar Demographics by Family Households with Children
Demographics Similar to Mexican American Indians by Family Households with Children
In terms of family households with children, the demographic groups most similar to Mexican American Indians are Guamanian/Chamorro (29.7%, a difference of 0.10%), Immigrants from Latin America (29.7%, a difference of 0.20%), Malaysian (29.8%, a difference of 0.27%), Immigrants from Laos (29.8%, a difference of 0.31%), and Immigrants from El Salvador (29.8%, a difference of 0.35%).
| Demographics | Rating | Rank | Family Households with Children |
| Immigrants | Afghanistan | 100.0 /100 | #16 | Exceptional 30.0% |
| Hispanics or Latinos | 100.0 /100 | #17 | Exceptional 29.9% |
| Salvadorans | 100.0 /100 | #18 | Exceptional 29.9% |
| Alaska Natives | 100.0 /100 | #19 | Exceptional 29.9% |
| Immigrants | El Salvador | 100.0 /100 | #20 | Exceptional 29.8% |
| Immigrants | Laos | 100.0 /100 | #21 | Exceptional 29.8% |
| Malaysians | 100.0 /100 | #22 | Exceptional 29.8% |
| Mexican American Indians | 100.0 /100 | #23 | Exceptional 29.7% |
| Guamanians/Chamorros | 100.0 /100 | #24 | Exceptional 29.7% |
| Immigrants | Latin America | 100.0 /100 | #25 | Exceptional 29.7% |
| Sri Lankans | 100.0 /100 | #26 | Exceptional 29.5% |
| Immigrants | Vietnam | 100.0 /100 | #27 | Exceptional 29.5% |
| Samoans | 100.0 /100 | #28 | Exceptional 29.5% |
| Bolivians | 100.0 /100 | #29 | Exceptional 29.5% |
| Yuman | 100.0 /100 | #30 | Exceptional 29.5% |
Demographics Similar to Immigrants from Eastern Africa by Family Households with Children
In terms of family households with children, the demographic groups most similar to Immigrants from Eastern Africa are Brazilian (27.7%, a difference of 0.020%), Immigrants from Chile (27.7%, a difference of 0.030%), Basque (27.7%, a difference of 0.030%), Swiss (27.7%, a difference of 0.040%), and Immigrants from Moldova (27.6%, a difference of 0.040%).
| Demographics | Rating | Rank | Family Households with Children |
| Immigrants | Portugal | 84.1 /100 | #136 | Excellent 27.7% |
| Immigrants | Dominican Republic | 83.9 /100 | #137 | Excellent 27.7% |
| Uruguayans | 83.2 /100 | #138 | Excellent 27.7% |
| Vietnamese | 82.6 /100 | #139 | Excellent 27.7% |
| Spanish | 81.8 /100 | #140 | Excellent 27.7% |
| Immigrants | Eastern Asia | 81.7 /100 | #141 | Excellent 27.7% |
| Swiss | 81.4 /100 | #142 | Excellent 27.7% |
| Immigrants | Eastern Africa | 80.2 /100 | #143 | Excellent 27.7% |
| Brazilians | 79.6 /100 | #144 | Good 27.7% |
| Immigrants | Chile | 79.5 /100 | #145 | Good 27.7% |
| Basques | 79.5 /100 | #146 | Good 27.7% |
| Immigrants | Moldova | 79.1 /100 | #147 | Good 27.6% |
| Osage | 79.0 /100 | #148 | Good 27.6% |
| Menominee | 78.9 /100 | #149 | Good 27.6% |
| Argentineans | 78.5 /100 | #150 | Good 27.6% |