Bangladeshi vs Immigrants from Eastern Africa Family Households with Children
COMPARE
Bangladeshi
Immigrants from Eastern Africa
Family Households with Children
Family Households with Children Comparison
Bangladeshis
Immigrants from Eastern Africa
30.1%
FAMILY HOUSEHOLDS WITH CHILDREN
100.0/ 100
METRIC RATING
14th/ 347
METRIC RANK
27.7%
FAMILY HOUSEHOLDS WITH CHILDREN
80.2/ 100
METRIC RATING
143rd/ 347
METRIC RANK
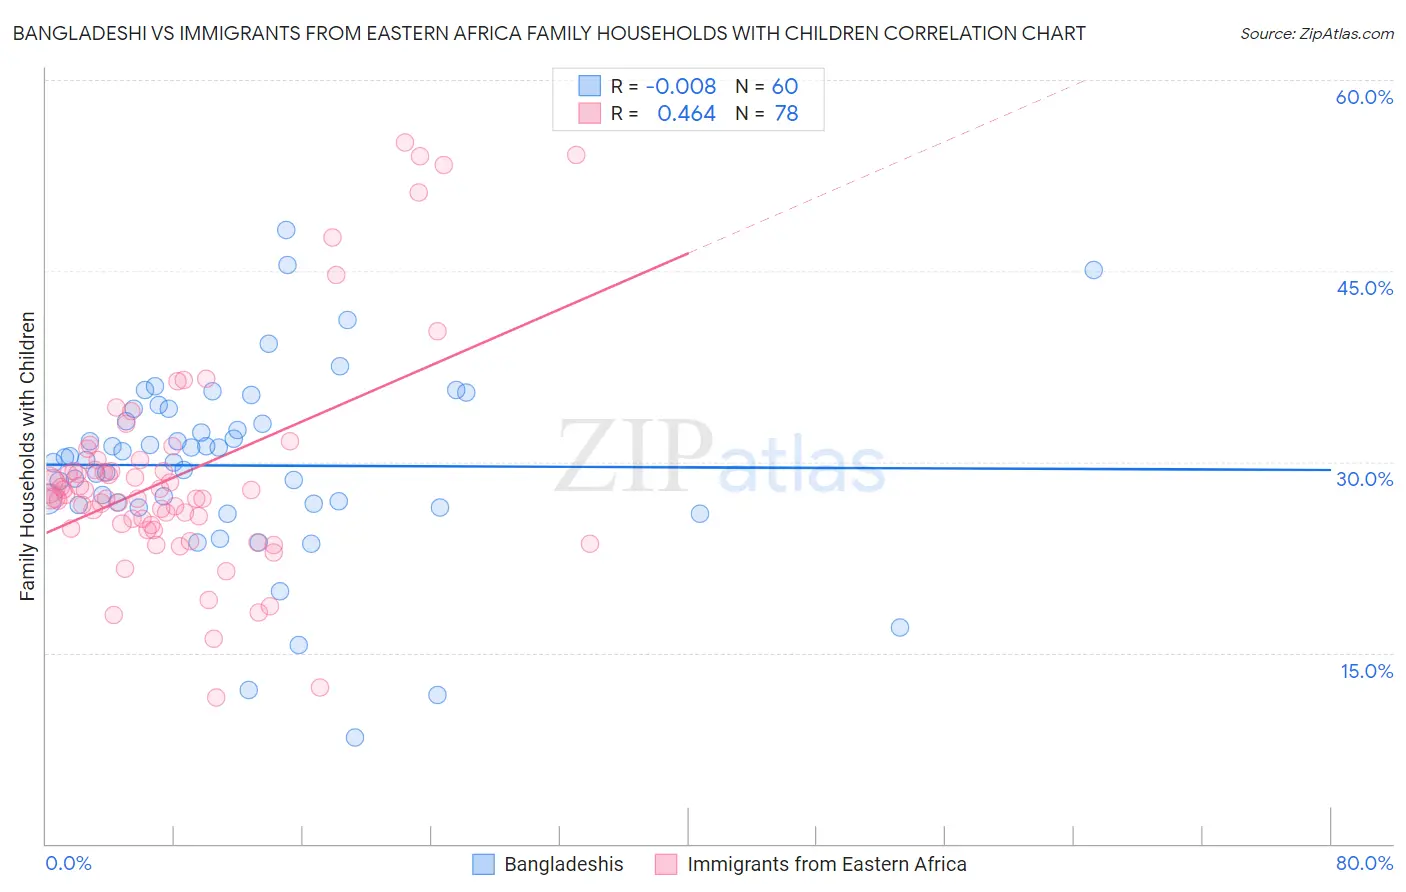
Bangladeshi vs Immigrants from Eastern Africa Family Households with Children Correlation Chart
The statistical analysis conducted on geographies consisting of 141,328,833 people shows no correlation between the proportion of Bangladeshis and percentage of family households with children in the United States with a correlation coefficient (R) of -0.008 and weighted average of 30.1%. Similarly, the statistical analysis conducted on geographies consisting of 354,810,617 people shows a moderate positive correlation between the proportion of Immigrants from Eastern Africa and percentage of family households with children in the United States with a correlation coefficient (R) of 0.464 and weighted average of 27.7%, a difference of 8.8%.
Family Households with Children Correlation Summary
| Measurement | Bangladeshi | Immigrants from Eastern Africa |
| Minimum | 8.3% | 11.5% |
| Maximum | 48.3% | 55.1% |
| Range | 39.9% | 43.6% |
| Mean | 29.7% | 29.0% |
| Median | 30.2% | 27.3% |
| Interquartile 25% (IQ1) | 26.6% | 25.0% |
| Interquartile 75% (IQ3) | 33.7% | 30.1% |
| Interquartile Range (IQR) | 7.1% | 5.1% |
| Standard Deviation (Sample) | 7.4% | 8.6% |
| Standard Deviation (Population) | 7.4% | 8.6% |
Similar Demographics by Family Households with Children
Demographics Similar to Bangladeshis by Family Households with Children
In terms of family households with children, the demographic groups most similar to Bangladeshis are Immigrants from South Central Asia (30.0%, a difference of 0.17%), Immigrants from Afghanistan (30.0%, a difference of 0.20%), Afghan (30.2%, a difference of 0.28%), Immigrants from Pakistan (30.2%, a difference of 0.52%), and Hispanic or Latino (29.9%, a difference of 0.58%).
| Demographics | Rating | Rank | Family Households with Children |
| Immigrants | Central America | 100.0 /100 | #7 | Exceptional 31.0% |
| Yakama | 100.0 /100 | #8 | Exceptional 30.8% |
| Thais | 100.0 /100 | #9 | Exceptional 30.6% |
| Immigrants | Fiji | 100.0 /100 | #10 | Exceptional 30.5% |
| Nepalese | 100.0 /100 | #11 | Exceptional 30.5% |
| Immigrants | Pakistan | 100.0 /100 | #12 | Exceptional 30.2% |
| Afghans | 100.0 /100 | #13 | Exceptional 30.2% |
| Bangladeshis | 100.0 /100 | #14 | Exceptional 30.1% |
| Immigrants | South Central Asia | 100.0 /100 | #15 | Exceptional 30.0% |
| Immigrants | Afghanistan | 100.0 /100 | #16 | Exceptional 30.0% |
| Hispanics or Latinos | 100.0 /100 | #17 | Exceptional 29.9% |
| Salvadorans | 100.0 /100 | #18 | Exceptional 29.9% |
| Alaska Natives | 100.0 /100 | #19 | Exceptional 29.9% |
| Immigrants | El Salvador | 100.0 /100 | #20 | Exceptional 29.8% |
| Immigrants | Laos | 100.0 /100 | #21 | Exceptional 29.8% |
Demographics Similar to Immigrants from Eastern Africa by Family Households with Children
In terms of family households with children, the demographic groups most similar to Immigrants from Eastern Africa are Brazilian (27.7%, a difference of 0.020%), Immigrants from Chile (27.7%, a difference of 0.030%), Basque (27.7%, a difference of 0.030%), Swiss (27.7%, a difference of 0.040%), and Immigrants from Moldova (27.6%, a difference of 0.040%).
| Demographics | Rating | Rank | Family Households with Children |
| Immigrants | Portugal | 84.1 /100 | #136 | Excellent 27.7% |
| Immigrants | Dominican Republic | 83.9 /100 | #137 | Excellent 27.7% |
| Uruguayans | 83.2 /100 | #138 | Excellent 27.7% |
| Vietnamese | 82.6 /100 | #139 | Excellent 27.7% |
| Spanish | 81.8 /100 | #140 | Excellent 27.7% |
| Immigrants | Eastern Asia | 81.7 /100 | #141 | Excellent 27.7% |
| Swiss | 81.4 /100 | #142 | Excellent 27.7% |
| Immigrants | Eastern Africa | 80.2 /100 | #143 | Excellent 27.7% |
| Brazilians | 79.6 /100 | #144 | Good 27.7% |
| Immigrants | Chile | 79.5 /100 | #145 | Good 27.7% |
| Basques | 79.5 /100 | #146 | Good 27.7% |
| Immigrants | Moldova | 79.1 /100 | #147 | Good 27.6% |
| Osage | 79.0 /100 | #148 | Good 27.6% |
| Menominee | 78.9 /100 | #149 | Good 27.6% |
| Argentineans | 78.5 /100 | #150 | Good 27.6% |