Mongolian vs Immigrants from Cambodia Family Households with Children
COMPARE
Mongolian
Immigrants from Cambodia
Family Households with Children
Family Households with Children Comparison
Mongolians
Immigrants from Cambodia
27.6%
FAMILY HOUSEHOLDS WITH CHILDREN
70.7/ 100
METRIC RATING
159th/ 347
METRIC RANK
28.9%
FAMILY HOUSEHOLDS WITH CHILDREN
100.0/ 100
METRIC RATING
53rd/ 347
METRIC RANK
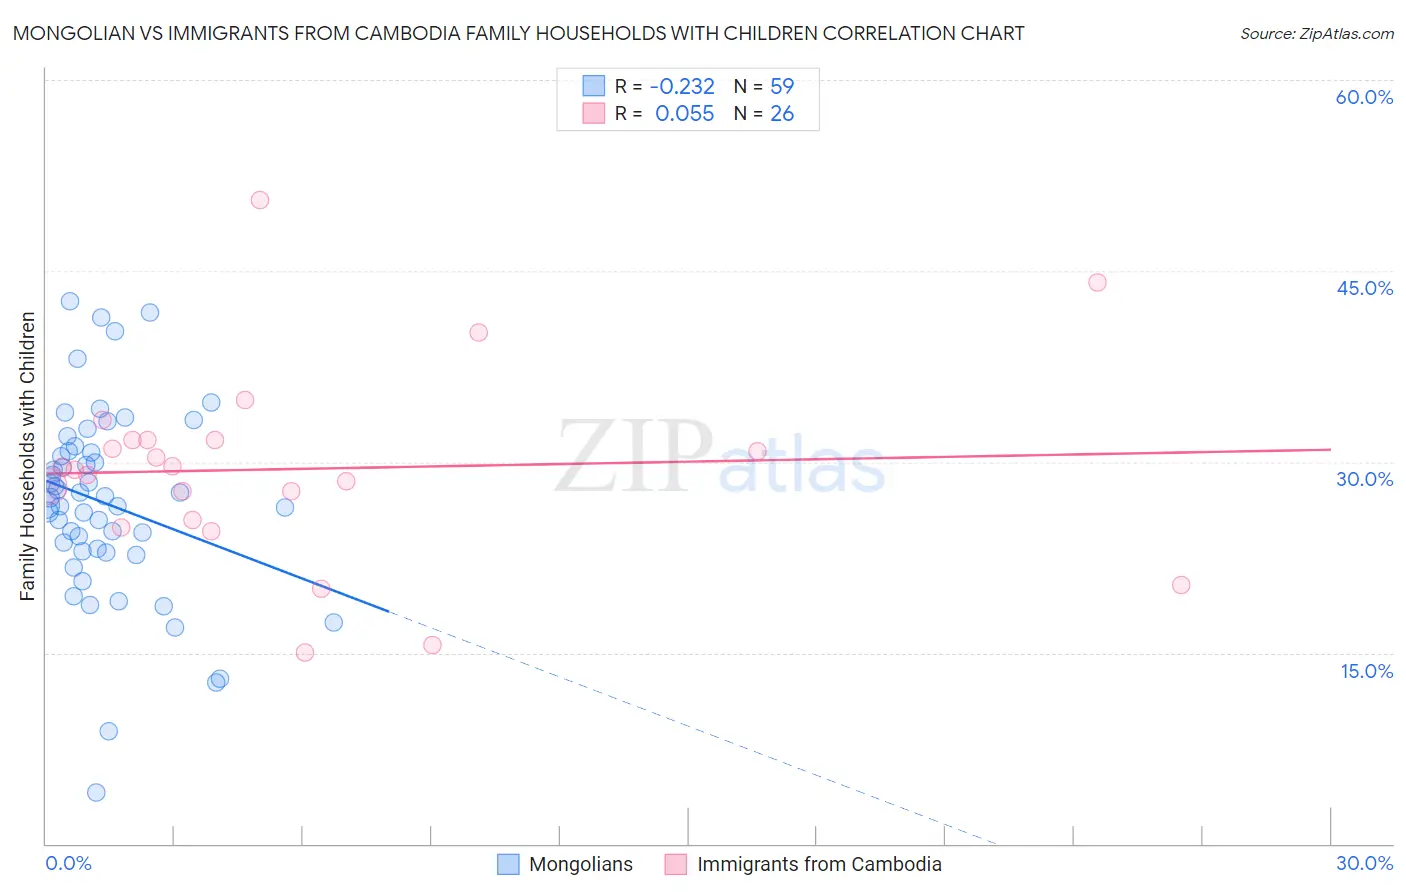
Mongolian vs Immigrants from Cambodia Family Households with Children Correlation Chart
The statistical analysis conducted on geographies consisting of 140,279,389 people shows a weak negative correlation between the proportion of Mongolians and percentage of family households with children in the United States with a correlation coefficient (R) of -0.232 and weighted average of 27.6%. Similarly, the statistical analysis conducted on geographies consisting of 205,128,905 people shows a slight positive correlation between the proportion of Immigrants from Cambodia and percentage of family households with children in the United States with a correlation coefficient (R) of 0.055 and weighted average of 28.9%, a difference of 4.7%.
Family Households with Children Correlation Summary
| Measurement | Mongolian | Immigrants from Cambodia |
| Minimum | 4.0% | 15.0% |
| Maximum | 42.6% | 50.6% |
| Range | 38.6% | 35.6% |
| Mean | 26.7% | 29.4% |
| Median | 27.2% | 29.5% |
| Interquartile 25% (IQ1) | 23.0% | 25.4% |
| Interquartile 75% (IQ3) | 30.8% | 31.7% |
| Interquartile Range (IQR) | 7.8% | 6.3% |
| Standard Deviation (Sample) | 7.5% | 7.7% |
| Standard Deviation (Population) | 7.5% | 7.5% |
Similar Demographics by Family Households with Children
Demographics Similar to Mongolians by Family Households with Children
In terms of family households with children, the demographic groups most similar to Mongolians are Romanian (27.6%, a difference of 0.0%), Indian (Asian) (27.6%, a difference of 0.020%), Subsaharan African (27.6%, a difference of 0.080%), Alaskan Athabascan (27.6%, a difference of 0.090%), and Immigrants from Bangladesh (27.6%, a difference of 0.10%).
| Demographics | Rating | Rank | Family Households with Children |
| Ethiopians | 77.0 /100 | #152 | Good 27.6% |
| Immigrants | Cabo Verde | 75.6 /100 | #153 | Good 27.6% |
| Icelanders | 75.3 /100 | #154 | Good 27.6% |
| Comanche | 74.8 /100 | #155 | Good 27.6% |
| Hungarians | 74.6 /100 | #156 | Good 27.6% |
| Indians (Asian) | 71.6 /100 | #157 | Good 27.6% |
| Romanians | 70.8 /100 | #158 | Good 27.6% |
| Mongolians | 70.7 /100 | #159 | Good 27.6% |
| Sub-Saharan Africans | 67.5 /100 | #160 | Good 27.6% |
| Alaskan Athabascans | 67.1 /100 | #161 | Good 27.6% |
| Immigrants | Bangladesh | 67.0 /100 | #162 | Good 27.6% |
| Czechs | 65.3 /100 | #163 | Good 27.5% |
| Immigrants | Hong Kong | 64.9 /100 | #164 | Good 27.5% |
| Immigrants | South Africa | 61.3 /100 | #165 | Good 27.5% |
| Immigrants | Nonimmigrants | 61.2 /100 | #166 | Good 27.5% |
Demographics Similar to Immigrants from Cambodia by Family Households with Children
In terms of family households with children, the demographic groups most similar to Immigrants from Cambodia are Guatemalan (28.9%, a difference of 0.070%), Sierra Leonean (28.9%, a difference of 0.080%), Immigrants from Asia (28.8%, a difference of 0.14%), Immigrants from Peru (28.9%, a difference of 0.15%), and Immigrants (28.9%, a difference of 0.19%).
| Demographics | Rating | Rank | Family Households with Children |
| Immigrants | Philippines | 100.0 /100 | #46 | Exceptional 29.0% |
| Peruvians | 100.0 /100 | #47 | Exceptional 29.0% |
| Apache | 100.0 /100 | #48 | Exceptional 29.0% |
| Jordanians | 100.0 /100 | #49 | Exceptional 29.0% |
| Immigrants | Immigrants | 100.0 /100 | #50 | Exceptional 28.9% |
| Immigrants | Peru | 100.0 /100 | #51 | Exceptional 28.9% |
| Guatemalans | 100.0 /100 | #52 | Exceptional 28.9% |
| Immigrants | Cambodia | 100.0 /100 | #53 | Exceptional 28.9% |
| Sierra Leoneans | 100.0 /100 | #54 | Exceptional 28.9% |
| Immigrants | Asia | 100.0 /100 | #55 | Exceptional 28.8% |
| Immigrants | Guatemala | 100.0 /100 | #56 | Exceptional 28.8% |
| Danes | 100.0 /100 | #57 | Exceptional 28.7% |
| Hawaiians | 100.0 /100 | #58 | Exceptional 28.7% |
| Immigrants | Nigeria | 100.0 /100 | #59 | Exceptional 28.6% |
| Hmong | 99.9 /100 | #60 | Exceptional 28.6% |