Maltese vs Alsatian 8th Grade
COMPARE
Maltese
Alsatian
8th Grade
8th Grade Comparison
Maltese
Alsatians
96.9%
8TH GRADE
99.9/ 100
METRIC RATING
44th/ 347
METRIC RANK
95.8%
8TH GRADE
61.4/ 100
METRIC RATING
165th/ 347
METRIC RANK
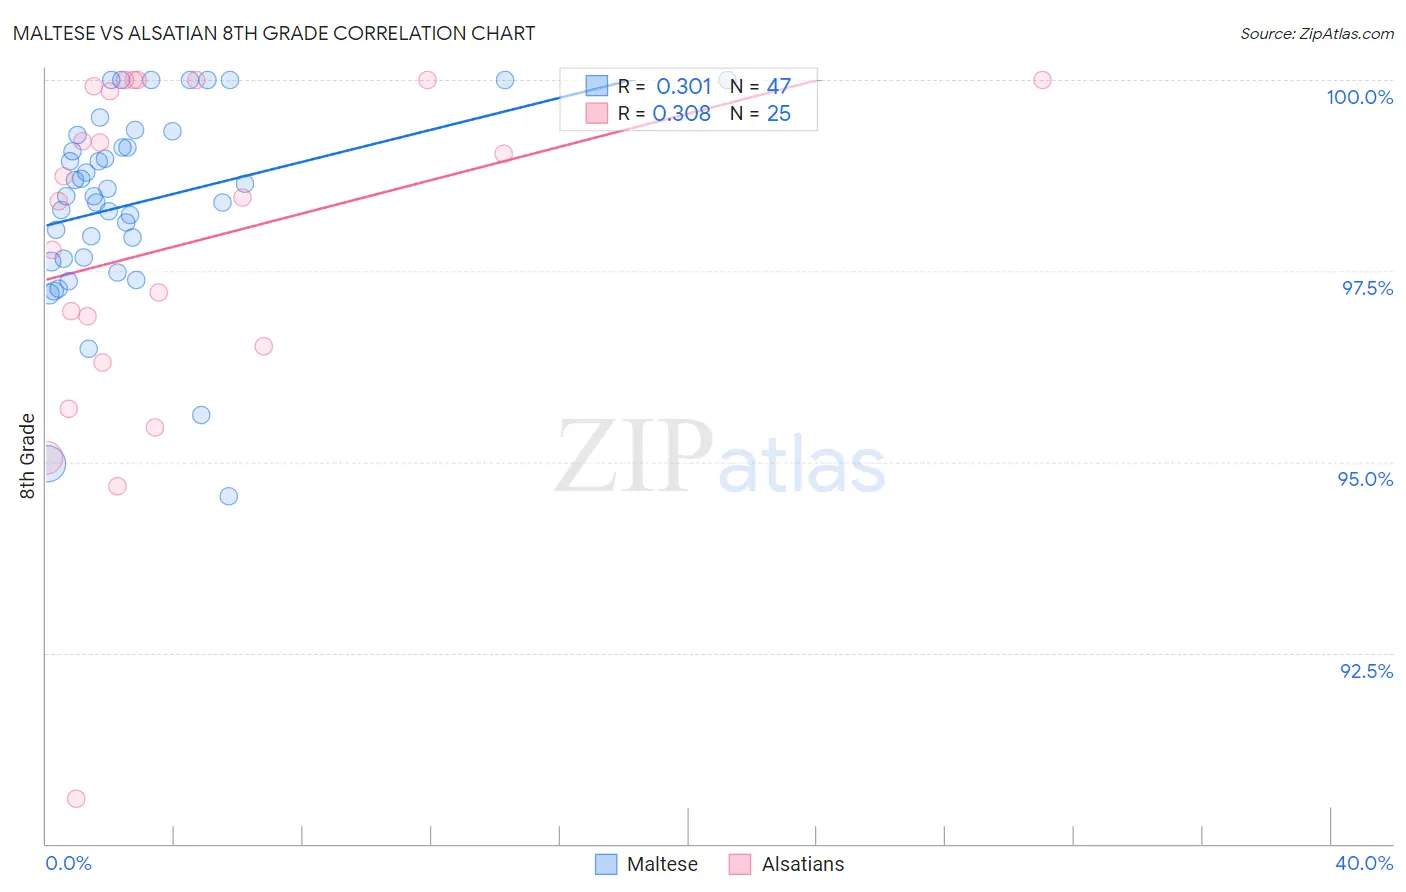
Maltese vs Alsatian 8th Grade Correlation Chart
The statistical analysis conducted on geographies consisting of 126,476,608 people shows a mild positive correlation between the proportion of Maltese and percentage of population with at least 8th grade education in the United States with a correlation coefficient (R) of 0.301 and weighted average of 96.9%. Similarly, the statistical analysis conducted on geographies consisting of 82,682,365 people shows a mild positive correlation between the proportion of Alsatians and percentage of population with at least 8th grade education in the United States with a correlation coefficient (R) of 0.308 and weighted average of 95.8%, a difference of 1.1%.
8th Grade Correlation Summary
| Measurement | Maltese | Alsatian |
| Minimum | 94.5% | 90.6% |
| Maximum | 100.0% | 100.0% |
| Range | 5.5% | 9.4% |
| Mean | 98.4% | 97.8% |
| Median | 98.5% | 98.5% |
| Interquartile 25% (IQ1) | 97.7% | 96.4% |
| Interquartile 75% (IQ3) | 99.3% | 100.0% |
| Interquartile Range (IQR) | 1.6% | 3.5% |
| Standard Deviation (Sample) | 1.3% | 2.3% |
| Standard Deviation (Population) | 1.3% | 2.3% |
Similar Demographics by 8th Grade
Demographics Similar to Maltese by 8th Grade
In terms of 8th grade, the demographic groups most similar to Maltese are Northern European (96.9%, a difference of 0.0%), Czechoslovakian (96.9%, a difference of 0.010%), Aleut (96.9%, a difference of 0.020%), Bulgarian (96.9%, a difference of 0.020%), and Chinese (96.9%, a difference of 0.050%).
| Demographics | Rating | Rank | 8th Grade |
| Latvians | 100.0 /100 | #37 | Exceptional 97.0% |
| British | 100.0 /100 | #38 | Exceptional 97.0% |
| Hungarians | 100.0 /100 | #39 | Exceptional 97.0% |
| Inupiat | 100.0 /100 | #40 | Exceptional 97.0% |
| Eastern Europeans | 100.0 /100 | #41 | Exceptional 97.0% |
| Chinese | 100.0 /100 | #42 | Exceptional 96.9% |
| Aleuts | 99.9 /100 | #43 | Exceptional 96.9% |
| Maltese | 99.9 /100 | #44 | Exceptional 96.9% |
| Northern Europeans | 99.9 /100 | #45 | Exceptional 96.9% |
| Czechoslovakians | 99.9 /100 | #46 | Exceptional 96.9% |
| Bulgarians | 99.9 /100 | #47 | Exceptional 96.9% |
| Slavs | 99.9 /100 | #48 | Exceptional 96.8% |
| Estonians | 99.9 /100 | #49 | Exceptional 96.8% |
| Immigrants | Scotland | 99.9 /100 | #50 | Exceptional 96.8% |
| Celtics | 99.9 /100 | #51 | Exceptional 96.8% |
Demographics Similar to Alsatians by 8th Grade
In terms of 8th grade, the demographic groups most similar to Alsatians are Immigrants from Poland (95.8%, a difference of 0.0%), Immigrants from Italy (95.8%, a difference of 0.010%), Spaniard (95.8%, a difference of 0.010%), Immigrants from Ukraine (95.8%, a difference of 0.010%), and Immigrants from Sri Lanka (95.8%, a difference of 0.020%).
| Demographics | Rating | Rank | 8th Grade |
| Arabs | 69.4 /100 | #158 | Good 95.9% |
| Immigrants | Kazakhstan | 68.4 /100 | #159 | Good 95.9% |
| Seminole | 67.7 /100 | #160 | Good 95.8% |
| Bermudans | 67.5 /100 | #161 | Good 95.8% |
| Immigrants | Kenya | 67.2 /100 | #162 | Good 95.8% |
| Immigrants | Sri Lanka | 64.1 /100 | #163 | Good 95.8% |
| Immigrants | Italy | 63.5 /100 | #164 | Good 95.8% |
| Alsatians | 61.4 /100 | #165 | Good 95.8% |
| Immigrants | Poland | 61.1 /100 | #166 | Good 95.8% |
| Spaniards | 60.0 /100 | #167 | Good 95.8% |
| Immigrants | Ukraine | 59.5 /100 | #168 | Average 95.8% |
| Immigrants | Iran | 58.6 /100 | #169 | Average 95.8% |
| Ute | 58.5 /100 | #170 | Average 95.8% |
| Egyptians | 58.2 /100 | #171 | Average 95.8% |
| Immigrants | Korea | 57.9 /100 | #172 | Average 95.8% |