Greek vs South African Divorced or Separated
COMPARE
Greek
South African
Divorced or Separated
Divorced or Separated Comparison
Greeks
South Africans
11.7%
DIVORCED OR SEPARATED
96.9/ 100
METRIC RATING
108th/ 347
METRIC RANK
11.8%
DIVORCED OR SEPARATED
88.9/ 100
METRIC RATING
127th/ 347
METRIC RANK
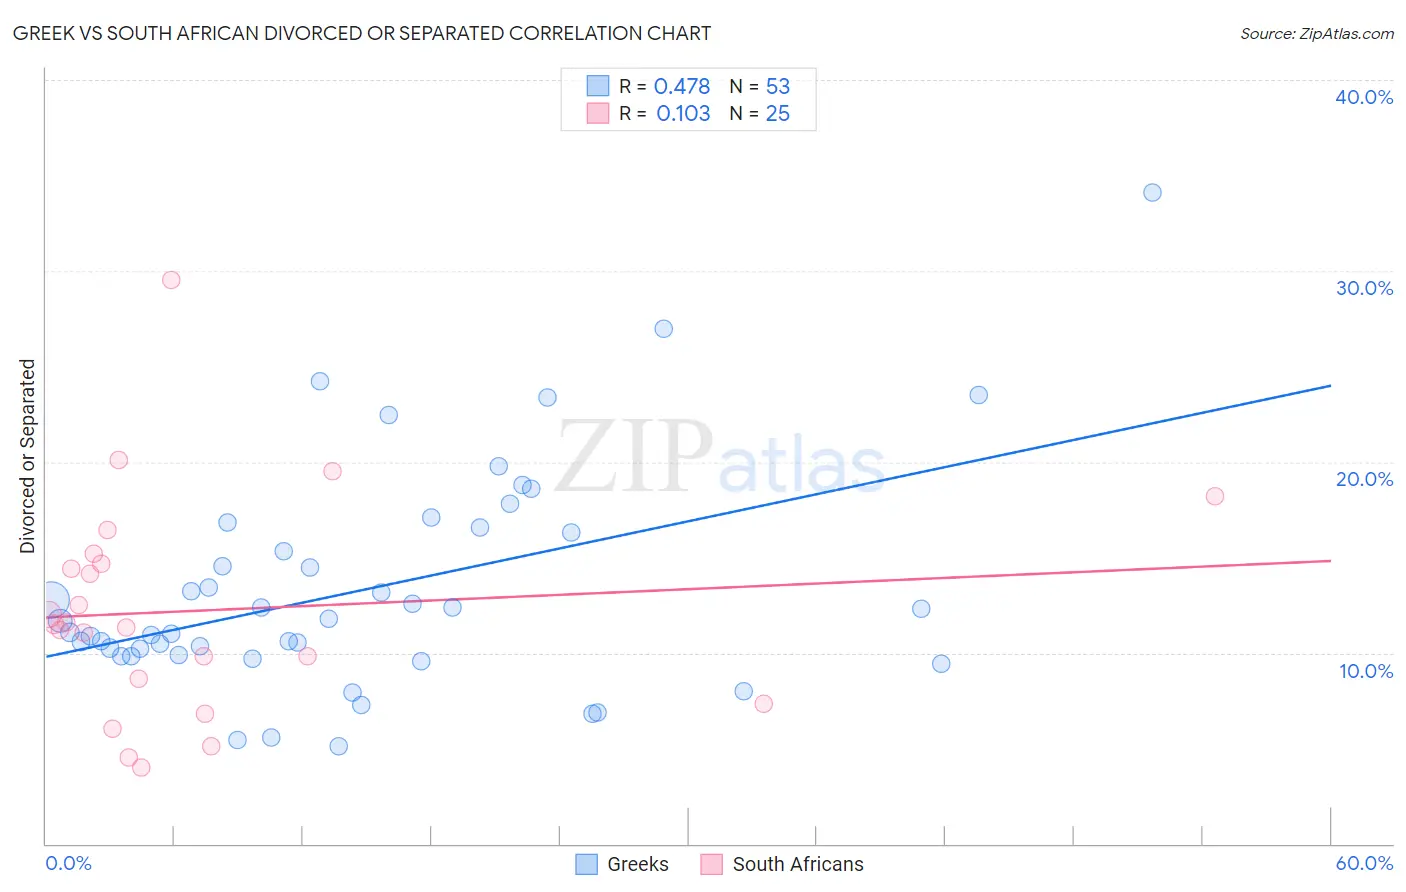
Greek vs South African Divorced or Separated Correlation Chart
The statistical analysis conducted on geographies consisting of 482,480,692 people shows a moderate positive correlation between the proportion of Greeks and percentage of population currently divorced or separated in the United States with a correlation coefficient (R) of 0.478 and weighted average of 11.7%. Similarly, the statistical analysis conducted on geographies consisting of 182,556,783 people shows a poor positive correlation between the proportion of South Africans and percentage of population currently divorced or separated in the United States with a correlation coefficient (R) of 0.103 and weighted average of 11.8%, a difference of 1.2%.
Divorced or Separated Correlation Summary
| Measurement | Greek | South African |
| Minimum | 5.1% | 4.0% |
| Maximum | 34.1% | 29.5% |
| Range | 29.0% | 25.5% |
| Mean | 13.3% | 12.2% |
| Median | 11.7% | 11.5% |
| Interquartile 25% (IQ1) | 9.9% | 8.0% |
| Interquartile 75% (IQ3) | 16.4% | 14.9% |
| Interquartile Range (IQR) | 6.6% | 7.0% |
| Standard Deviation (Sample) | 5.8% | 5.7% |
| Standard Deviation (Population) | 5.7% | 5.6% |
Demographics Similar to Greeks and South Africans by Divorced or Separated
In terms of divorced or separated, the demographic groups most similar to Greeks are Immigrants from South Africa (11.7%, a difference of 0.010%), Immigrants from Czechoslovakia (11.7%, a difference of 0.010%), Immigrants from Spain (11.7%, a difference of 0.050%), Native Hawaiian (11.7%, a difference of 0.090%), and Immigrants from France (11.7%, a difference of 0.10%). Similarly, the demographic groups most similar to South Africans are South American Indian (11.8%, a difference of 0.34%), Ukrainian (11.8%, a difference of 0.36%), Ugandan (11.8%, a difference of 0.47%), Immigrants (11.8%, a difference of 0.55%), and Menominee (11.8%, a difference of 0.56%).
| Demographics | Rating | Rank | Divorced or Separated |
| Native Hawaiians | 97.2 /100 | #107 | Exceptional 11.7% |
| Greeks | 96.9 /100 | #108 | Exceptional 11.7% |
| Immigrants | South Africa | 96.9 /100 | #109 | Exceptional 11.7% |
| Immigrants | Czechoslovakia | 96.9 /100 | #110 | Exceptional 11.7% |
| Immigrants | Spain | 96.8 /100 | #111 | Exceptional 11.7% |
| Immigrants | France | 96.6 /100 | #112 | Exceptional 11.7% |
| Estonians | 96.6 /100 | #113 | Exceptional 11.7% |
| Immigrants | Norway | 95.9 /100 | #114 | Exceptional 11.7% |
| Lithuanians | 95.7 /100 | #115 | Exceptional 11.7% |
| Immigrants | Iraq | 95.4 /100 | #116 | Exceptional 11.7% |
| Immigrants | Uganda | 95.3 /100 | #117 | Exceptional 11.7% |
| Ecuadorians | 95.3 /100 | #118 | Exceptional 11.7% |
| Syrians | 95.1 /100 | #119 | Exceptional 11.7% |
| Iraqis | 94.6 /100 | #120 | Exceptional 11.8% |
| Romanians | 94.5 /100 | #121 | Exceptional 11.8% |
| Menominee | 93.8 /100 | #122 | Exceptional 11.8% |
| Immigrants | Immigrants | 93.7 /100 | #123 | Exceptional 11.8% |
| Ugandans | 93.1 /100 | #124 | Exceptional 11.8% |
| Ukrainians | 92.3 /100 | #125 | Exceptional 11.8% |
| South American Indians | 92.1 /100 | #126 | Exceptional 11.8% |
| South Africans | 88.9 /100 | #127 | Excellent 11.8% |