Jamaican vs Palestinian Births to Unmarried Women
COMPARE
Jamaican
Palestinian
Births to Unmarried Women
Births to Unmarried Women Comparison
Jamaicans
Palestinians
38.5%
BIRTHS TO UNMARRIED WOMEN
0.0/ 100
METRIC RATING
298th/ 347
METRIC RANK
28.4%
BIRTHS TO UNMARRIED WOMEN
98.7/ 100
METRIC RATING
67th/ 347
METRIC RANK
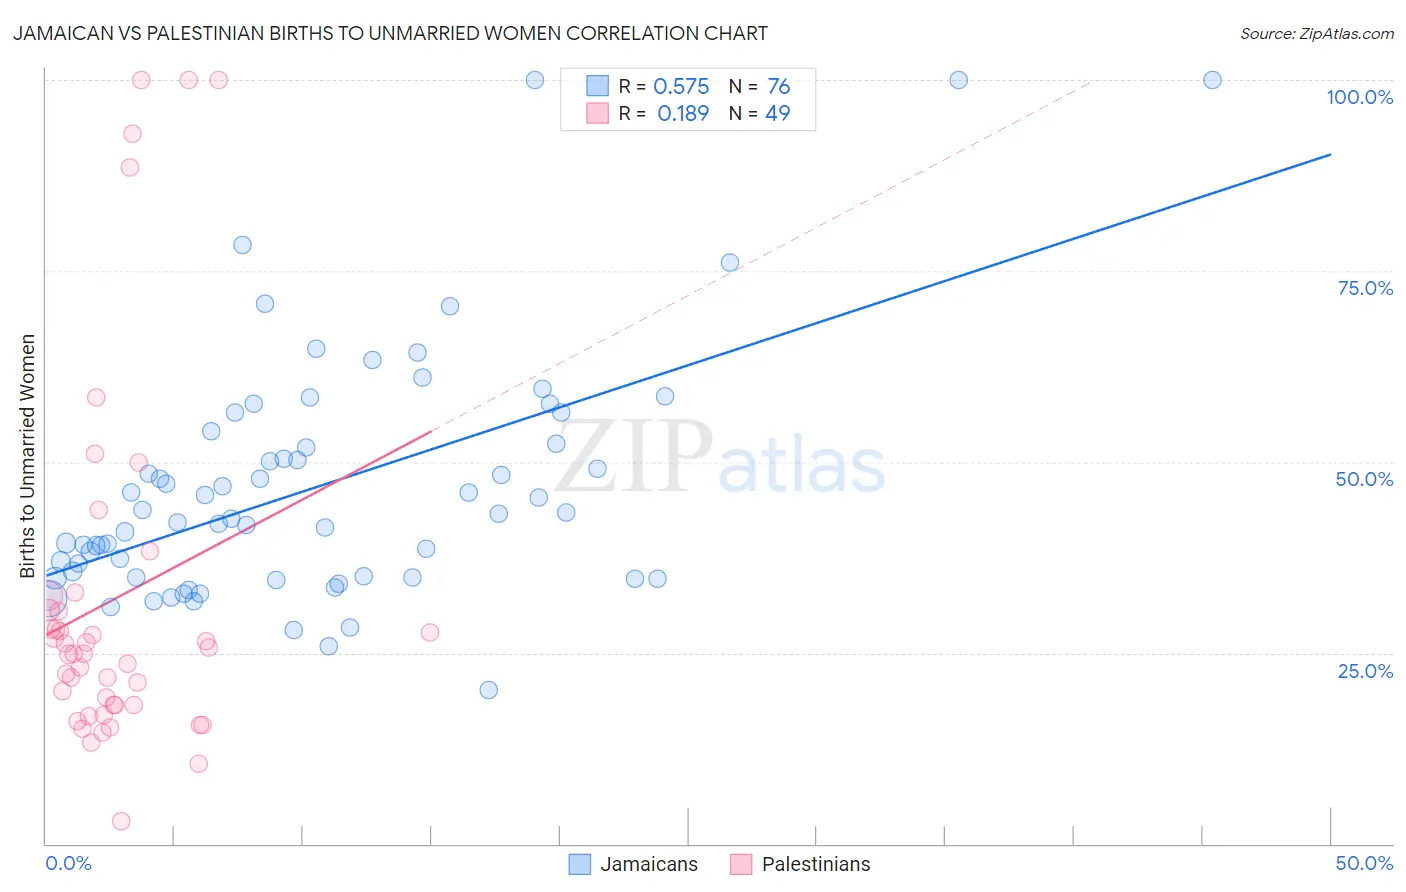
Jamaican vs Palestinian Births to Unmarried Women Correlation Chart
The statistical analysis conducted on geographies consisting of 347,671,371 people shows a substantial positive correlation between the proportion of Jamaicans and percentage of births to unmarried women in the United States with a correlation coefficient (R) of 0.575 and weighted average of 38.5%. Similarly, the statistical analysis conducted on geographies consisting of 207,464,489 people shows a poor positive correlation between the proportion of Palestinians and percentage of births to unmarried women in the United States with a correlation coefficient (R) of 0.189 and weighted average of 28.4%, a difference of 35.4%.
Births to Unmarried Women Correlation Summary
| Measurement | Jamaican | Palestinian |
| Minimum | 20.2% | 2.9% |
| Maximum | 100.0% | 100.0% |
| Range | 79.8% | 97.1% |
| Mean | 46.7% | 32.1% |
| Median | 42.9% | 24.9% |
| Interquartile 25% (IQ1) | 34.9% | 18.1% |
| Interquartile 75% (IQ3) | 53.2% | 31.6% |
| Interquartile Range (IQR) | 18.3% | 13.5% |
| Standard Deviation (Sample) | 16.1% | 24.2% |
| Standard Deviation (Population) | 16.0% | 23.9% |
Similar Demographics by Births to Unmarried Women
Demographics Similar to Jamaicans by Births to Unmarried Women
In terms of births to unmarried women, the demographic groups most similar to Jamaicans are Dutch West Indian (38.4%, a difference of 0.20%), Spanish American (38.6%, a difference of 0.20%), Immigrants from West Indies (38.6%, a difference of 0.26%), Haitian (38.6%, a difference of 0.27%), and Alaska Native (38.3%, a difference of 0.48%).
| Demographics | Rating | Rank | Births to Unmarried Women |
| Seminole | 0.0 /100 | #291 | Tragic 37.9% |
| Blackfeet | 0.0 /100 | #292 | Tragic 37.9% |
| Immigrants | Nicaragua | 0.0 /100 | #293 | Tragic 38.0% |
| British West Indians | 0.0 /100 | #294 | Tragic 38.0% |
| Iroquois | 0.0 /100 | #295 | Tragic 38.2% |
| Alaska Natives | 0.0 /100 | #296 | Tragic 38.3% |
| Dutch West Indians | 0.0 /100 | #297 | Tragic 38.4% |
| Jamaicans | 0.0 /100 | #298 | Tragic 38.5% |
| Spanish Americans | 0.0 /100 | #299 | Tragic 38.6% |
| Immigrants | West Indies | 0.0 /100 | #300 | Tragic 38.6% |
| Haitians | 0.0 /100 | #301 | Tragic 38.6% |
| Hondurans | 0.0 /100 | #302 | Tragic 38.7% |
| Immigrants | Jamaica | 0.0 /100 | #303 | Tragic 38.8% |
| Yaqui | 0.0 /100 | #304 | Tragic 38.8% |
| Immigrants | Haiti | 0.0 /100 | #305 | Tragic 38.9% |
Demographics Similar to Palestinians by Births to Unmarried Women
In terms of births to unmarried women, the demographic groups most similar to Palestinians are Immigrants from Europe (28.4%, a difference of 0.050%), Bolivian (28.5%, a difference of 0.090%), Immigrants from Egypt (28.4%, a difference of 0.11%), Immigrants from Czechoslovakia (28.4%, a difference of 0.13%), and Tongan (28.4%, a difference of 0.15%).
| Demographics | Rating | Rank | Births to Unmarried Women |
| Immigrants | Turkey | 99.1 /100 | #60 | Exceptional 28.1% |
| Immigrants | North Macedonia | 99.1 /100 | #61 | Exceptional 28.1% |
| Egyptians | 99.0 /100 | #62 | Exceptional 28.2% |
| Immigrants | Serbia | 98.9 /100 | #63 | Exceptional 28.3% |
| Tongans | 98.8 /100 | #64 | Exceptional 28.4% |
| Immigrants | Czechoslovakia | 98.8 /100 | #65 | Exceptional 28.4% |
| Immigrants | Egypt | 98.8 /100 | #66 | Exceptional 28.4% |
| Palestinians | 98.7 /100 | #67 | Exceptional 28.4% |
| Immigrants | Europe | 98.7 /100 | #68 | Exceptional 28.4% |
| Bolivians | 98.7 /100 | #69 | Exceptional 28.5% |
| Laotians | 98.6 /100 | #70 | Exceptional 28.5% |
| Jordanians | 98.5 /100 | #71 | Exceptional 28.5% |
| Immigrants | Sweden | 98.5 /100 | #72 | Exceptional 28.5% |
| Albanians | 98.5 /100 | #73 | Exceptional 28.5% |
| Immigrants | Bolivia | 98.5 /100 | #74 | Exceptional 28.6% |