Italian vs British West Indian Single Father Households
COMPARE
Italian
British West Indian
Single Father Households
Single Father Households Comparison
Italians
British West Indians
2.2%
SINGLE FATHER HOUSEHOLDS
98.3/ 100
METRIC RATING
110th/ 347
METRIC RANK
2.2%
SINGLE FATHER HOUSEHOLDS
97.4/ 100
METRIC RATING
124th/ 347
METRIC RANK
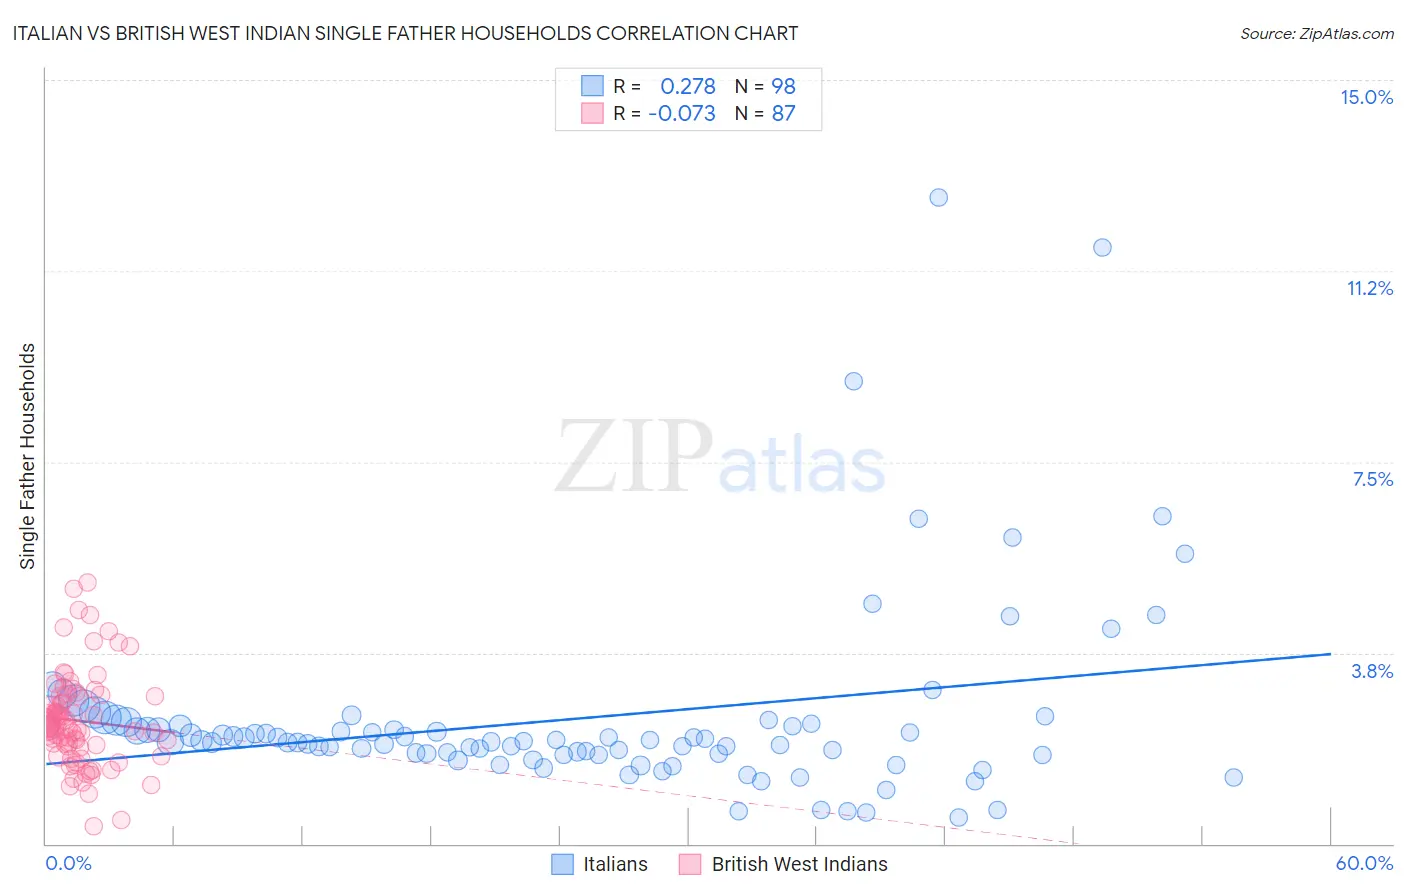
Italian vs British West Indian Single Father Households Correlation Chart
The statistical analysis conducted on geographies consisting of 559,287,230 people shows a weak positive correlation between the proportion of Italians and percentage of single father households in the United States with a correlation coefficient (R) of 0.278 and weighted average of 2.2%. Similarly, the statistical analysis conducted on geographies consisting of 152,266,714 people shows a slight negative correlation between the proportion of British West Indians and percentage of single father households in the United States with a correlation coefficient (R) of -0.073 and weighted average of 2.2%, a difference of 0.89%.
Single Father Households Correlation Summary
| Measurement | Italian | British West Indian |
| Minimum | 0.51% | 0.35% |
| Maximum | 12.7% | 5.1% |
| Range | 12.2% | 4.8% |
| Mean | 2.5% | 2.4% |
| Median | 2.0% | 2.3% |
| Interquartile 25% (IQ1) | 1.8% | 1.9% |
| Interquartile 75% (IQ3) | 2.3% | 2.9% |
| Interquartile Range (IQR) | 0.56% | 0.98% |
| Standard Deviation (Sample) | 1.9% | 0.92% |
| Standard Deviation (Population) | 1.9% | 0.91% |
Demographics Similar to Italians and British West Indians by Single Father Households
In terms of single father households, the demographic groups most similar to Italians are Immigrants from Canada (2.2%, a difference of 0.080%), Immigrants from Trinidad and Tobago (2.2%, a difference of 0.12%), Barbadian (2.2%, a difference of 0.13%), Iraqi (2.2%, a difference of 0.13%), and Immigrants from Netherlands (2.2%, a difference of 0.16%). Similarly, the demographic groups most similar to British West Indians are Immigrants from Yemen (2.2%, a difference of 0.020%), Immigrants from Indonesia (2.2%, a difference of 0.050%), Immigrants from Iraq (2.2%, a difference of 0.17%), Australian (2.2%, a difference of 0.27%), and Immigrants from Brazil (2.2%, a difference of 0.27%).
| Demographics | Rating | Rank | Single Father Households |
| Slovenes | 98.5 /100 | #107 | Exceptional 2.2% |
| Immigrants | Netherlands | 98.5 /100 | #108 | Exceptional 2.2% |
| Barbadians | 98.4 /100 | #109 | Exceptional 2.2% |
| Italians | 98.3 /100 | #110 | Exceptional 2.2% |
| Immigrants | Canada | 98.3 /100 | #111 | Exceptional 2.2% |
| Immigrants | Trinidad and Tobago | 98.2 /100 | #112 | Exceptional 2.2% |
| Iraqis | 98.2 /100 | #113 | Exceptional 2.2% |
| Immigrants | North America | 98.2 /100 | #114 | Exceptional 2.2% |
| Immigrants | Barbados | 98.2 /100 | #115 | Exceptional 2.2% |
| Immigrants | Argentina | 98.1 /100 | #116 | Exceptional 2.2% |
| Hungarians | 97.9 /100 | #117 | Exceptional 2.2% |
| Immigrants | Morocco | 97.8 /100 | #118 | Exceptional 2.2% |
| Trinidadians and Tobagonians | 97.8 /100 | #119 | Exceptional 2.2% |
| Australians | 97.7 /100 | #120 | Exceptional 2.2% |
| Immigrants | Brazil | 97.7 /100 | #121 | Exceptional 2.2% |
| Immigrants | Iraq | 97.6 /100 | #122 | Exceptional 2.2% |
| Immigrants | Yemen | 97.5 /100 | #123 | Exceptional 2.2% |
| British West Indians | 97.4 /100 | #124 | Exceptional 2.2% |
| Immigrants | Indonesia | 97.4 /100 | #125 | Exceptional 2.2% |
| Moroccans | 96.9 /100 | #126 | Exceptional 2.2% |
| Jordanians | 96.9 /100 | #127 | Exceptional 2.2% |