Immigrants from Cuba vs Croatian Single Mother Households
COMPARE
Immigrants from Cuba
Croatian
Single Mother Households
Single Mother Households Comparison
Immigrants from Cuba
Croatians
7.5%
SINGLE MOTHER HOUSEHOLDS
0.1/ 100
METRIC RATING
270th/ 347
METRIC RANK
5.5%
SINGLE MOTHER HOUSEHOLDS
99.3/ 100
METRIC RATING
46th/ 347
METRIC RANK
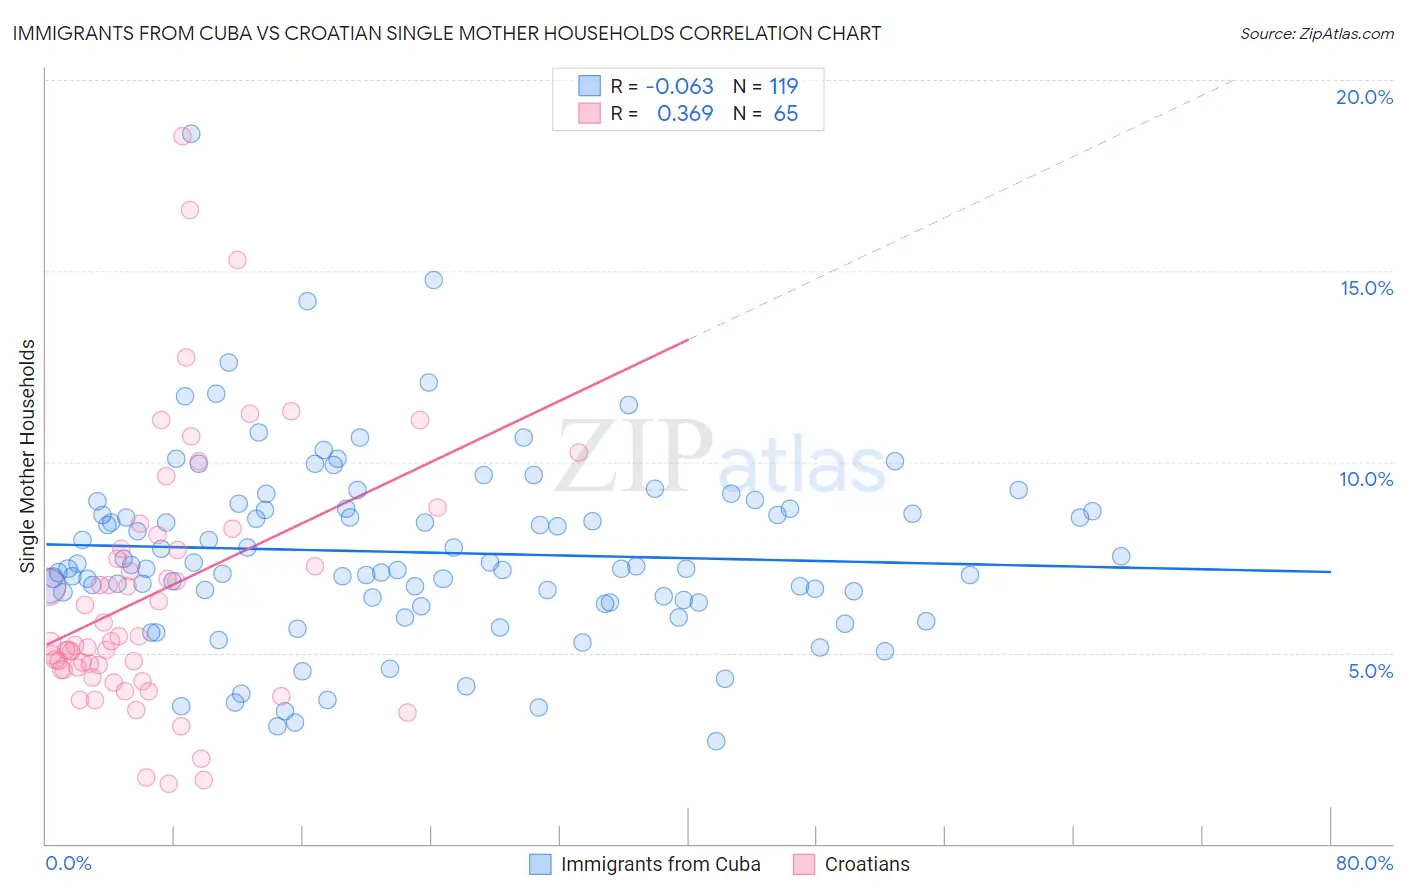
Immigrants from Cuba vs Croatian Single Mother Households Correlation Chart
The statistical analysis conducted on geographies consisting of 325,295,846 people shows a slight negative correlation between the proportion of Immigrants from Cuba and percentage of single mother households in the United States with a correlation coefficient (R) of -0.063 and weighted average of 7.5%. Similarly, the statistical analysis conducted on geographies consisting of 374,465,881 people shows a mild positive correlation between the proportion of Croatians and percentage of single mother households in the United States with a correlation coefficient (R) of 0.369 and weighted average of 5.5%, a difference of 38.0%.
Single Mother Households Correlation Summary
| Measurement | Immigrants from Cuba | Croatian |
| Minimum | 2.7% | 1.6% |
| Maximum | 18.6% | 18.5% |
| Range | 15.9% | 16.9% |
| Mean | 7.6% | 6.6% |
| Median | 7.2% | 5.3% |
| Interquartile 25% (IQ1) | 6.4% | 4.6% |
| Interquartile 75% (IQ3) | 8.8% | 7.9% |
| Interquartile Range (IQR) | 2.4% | 3.4% |
| Standard Deviation (Sample) | 2.4% | 3.4% |
| Standard Deviation (Population) | 2.4% | 3.4% |
Similar Demographics by Single Mother Households
Demographics Similar to Immigrants from Cuba by Single Mother Households
In terms of single mother households, the demographic groups most similar to Immigrants from Cuba are Salvadoran (7.5%, a difference of 0.090%), Immigrants from the Azores (7.5%, a difference of 0.090%), Somali (7.5%, a difference of 0.16%), Belizean (7.6%, a difference of 0.40%), and Immigrants from Guyana (7.6%, a difference of 0.45%).
| Demographics | Rating | Rank | Single Mother Households |
| Immigrants | Nicaragua | 0.2 /100 | #263 | Tragic 7.4% |
| Yaqui | 0.1 /100 | #264 | Tragic 7.4% |
| Crow | 0.1 /100 | #265 | Tragic 7.4% |
| Nepalese | 0.1 /100 | #266 | Tragic 7.5% |
| Blackfeet | 0.1 /100 | #267 | Tragic 7.5% |
| Indonesians | 0.1 /100 | #268 | Tragic 7.5% |
| Somalis | 0.1 /100 | #269 | Tragic 7.5% |
| Immigrants | Cuba | 0.1 /100 | #270 | Tragic 7.5% |
| Salvadorans | 0.1 /100 | #271 | Tragic 7.5% |
| Immigrants | Azores | 0.1 /100 | #272 | Tragic 7.5% |
| Belizeans | 0.1 /100 | #273 | Tragic 7.6% |
| Immigrants | Guyana | 0.1 /100 | #274 | Tragic 7.6% |
| Central American Indians | 0.1 /100 | #275 | Tragic 7.6% |
| Guyanese | 0.1 /100 | #276 | Tragic 7.6% |
| Immigrants | Trinidad and Tobago | 0.1 /100 | #277 | Tragic 7.6% |
Demographics Similar to Croatians by Single Mother Households
In terms of single mother households, the demographic groups most similar to Croatians are Norwegian (5.5%, a difference of 0.18%), Immigrants from Croatia (5.4%, a difference of 0.26%), Lithuanian (5.4%, a difference of 0.38%), Turkish (5.5%, a difference of 0.38%), and Immigrants from Latvia (5.5%, a difference of 0.41%).
| Demographics | Rating | Rank | Single Mother Households |
| Immigrants | Sweden | 99.6 /100 | #39 | Exceptional 5.4% |
| Estonians | 99.6 /100 | #40 | Exceptional 5.4% |
| Immigrants | Greece | 99.5 /100 | #41 | Exceptional 5.4% |
| Macedonians | 99.5 /100 | #42 | Exceptional 5.4% |
| Immigrants | South Central Asia | 99.5 /100 | #43 | Exceptional 5.4% |
| Lithuanians | 99.4 /100 | #44 | Exceptional 5.4% |
| Immigrants | Croatia | 99.4 /100 | #45 | Exceptional 5.4% |
| Croatians | 99.3 /100 | #46 | Exceptional 5.5% |
| Norwegians | 99.3 /100 | #47 | Exceptional 5.5% |
| Turks | 99.2 /100 | #48 | Exceptional 5.5% |
| Immigrants | Latvia | 99.2 /100 | #49 | Exceptional 5.5% |
| Immigrants | Scotland | 99.2 /100 | #50 | Exceptional 5.5% |
| Immigrants | Belarus | 99.2 /100 | #51 | Exceptional 5.5% |
| Swedes | 99.1 /100 | #52 | Exceptional 5.5% |
| Immigrants | Russia | 99.1 /100 | #53 | Exceptional 5.5% |