Immigrants from Zaire vs Immigrants from Ecuador Currently Married
COMPARE
Immigrants from Zaire
Immigrants from Ecuador
Currently Married
Currently Married Comparison
Immigrants from Zaire
Immigrants from Ecuador
42.0%
CURRENTLY MARRIED
0.0/ 100
METRIC RATING
302nd/ 347
METRIC RANK
43.2%
CURRENTLY MARRIED
0.0/ 100
METRIC RATING
282nd/ 347
METRIC RANK
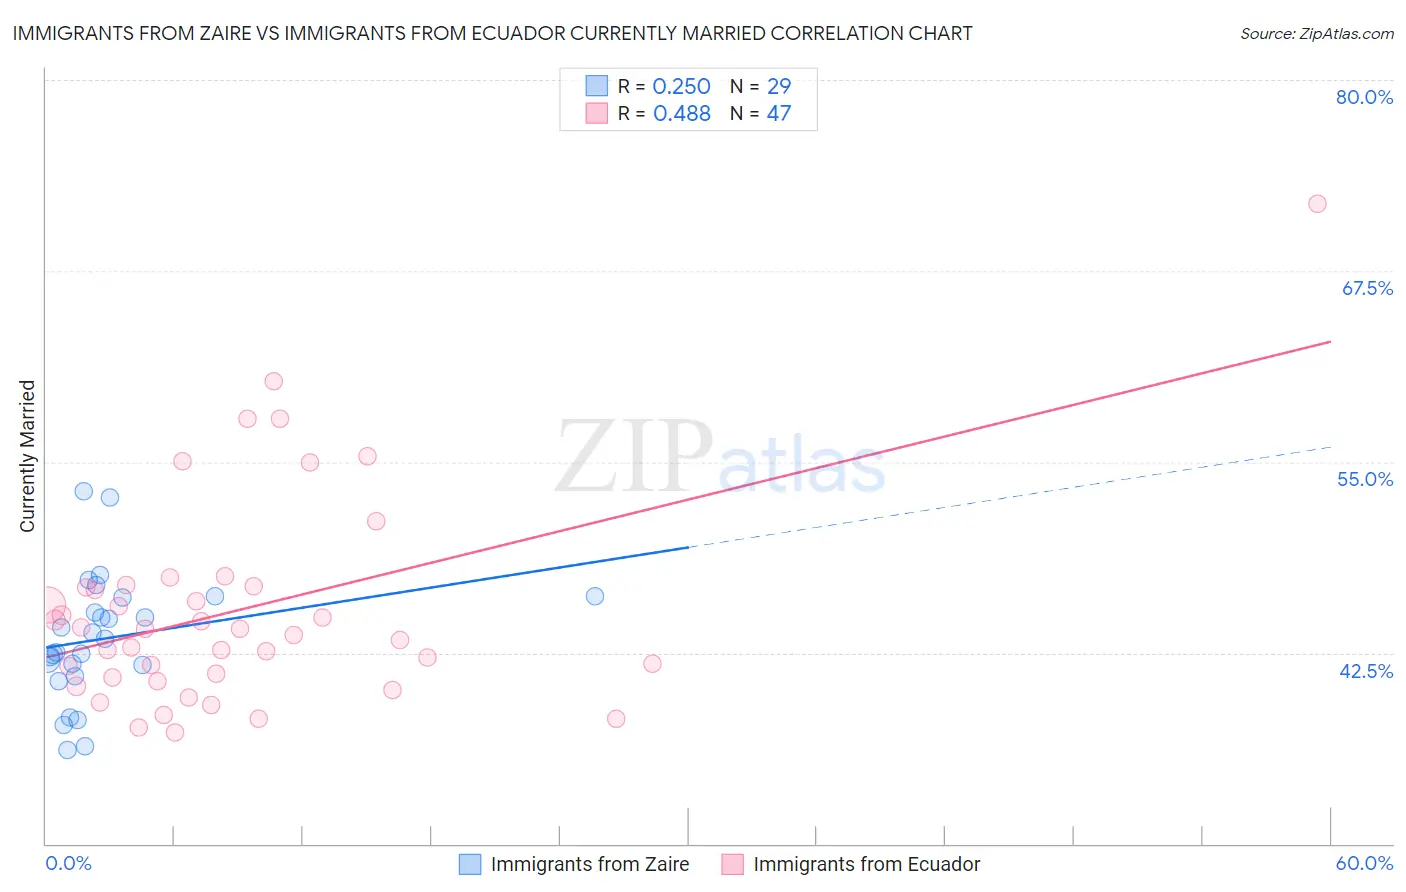
Immigrants from Zaire vs Immigrants from Ecuador Currently Married Correlation Chart
The statistical analysis conducted on geographies consisting of 107,251,110 people shows a weak positive correlation between the proportion of Immigrants from Zaire and percentage of population currently married in the United States with a correlation coefficient (R) of 0.250 and weighted average of 42.0%. Similarly, the statistical analysis conducted on geographies consisting of 270,997,790 people shows a moderate positive correlation between the proportion of Immigrants from Ecuador and percentage of population currently married in the United States with a correlation coefficient (R) of 0.488 and weighted average of 43.2%, a difference of 3.0%.
Currently Married Correlation Summary
| Measurement | Immigrants from Zaire | Immigrants from Ecuador |
| Minimum | 36.1% | 37.2% |
| Maximum | 53.1% | 71.9% |
| Range | 16.9% | 34.7% |
| Mean | 43.5% | 45.3% |
| Median | 43.4% | 44.1% |
| Interquartile 25% (IQ1) | 41.4% | 40.9% |
| Interquartile 75% (IQ3) | 46.1% | 46.8% |
| Interquartile Range (IQR) | 4.8% | 6.0% |
| Standard Deviation (Sample) | 4.1% | 6.9% |
| Standard Deviation (Population) | 4.0% | 6.8% |
Demographics Similar to Immigrants from Zaire and Immigrants from Ecuador by Currently Married
In terms of currently married, the demographic groups most similar to Immigrants from Zaire are Immigrants from Yemen (42.1%, a difference of 0.25%), Belizean (42.2%, a difference of 0.49%), Liberian (42.2%, a difference of 0.58%), Immigrants from Honduras (42.2%, a difference of 0.62%), and Cheyenne (42.2%, a difference of 0.71%). Similarly, the demographic groups most similar to Immigrants from Ecuador are Kiowa (43.2%, a difference of 0.11%), Immigrants from El Salvador (43.1%, a difference of 0.12%), Immigrants from Middle Africa (43.0%, a difference of 0.52%), Ghanaian (42.9%, a difference of 0.65%), and Guatemalan (42.9%, a difference of 0.67%).
| Demographics | Rating | Rank | Currently Married |
| Immigrants | Ecuador | 0.0 /100 | #282 | Tragic 43.2% |
| Kiowa | 0.0 /100 | #283 | Tragic 43.2% |
| Immigrants | El Salvador | 0.0 /100 | #284 | Tragic 43.1% |
| Immigrants | Middle Africa | 0.0 /100 | #285 | Tragic 43.0% |
| Ghanaians | 0.0 /100 | #286 | Tragic 42.9% |
| Guatemalans | 0.0 /100 | #287 | Tragic 42.9% |
| Natives/Alaskans | 0.0 /100 | #288 | Tragic 42.8% |
| Paiute | 0.0 /100 | #289 | Tragic 42.7% |
| Immigrants | Ghana | 0.0 /100 | #290 | Tragic 42.7% |
| Immigrants | Guatemala | 0.0 /100 | #291 | Tragic 42.6% |
| Sub-Saharan Africans | 0.0 /100 | #292 | Tragic 42.6% |
| Yuman | 0.0 /100 | #293 | Tragic 42.6% |
| Hondurans | 0.0 /100 | #294 | Tragic 42.5% |
| Immigrants | Western Africa | 0.0 /100 | #295 | Tragic 42.4% |
| Menominee | 0.0 /100 | #296 | Tragic 42.3% |
| Cheyenne | 0.0 /100 | #297 | Tragic 42.2% |
| Immigrants | Honduras | 0.0 /100 | #298 | Tragic 42.2% |
| Liberians | 0.0 /100 | #299 | Tragic 42.2% |
| Belizeans | 0.0 /100 | #300 | Tragic 42.2% |
| Immigrants | Yemen | 0.0 /100 | #301 | Tragic 42.1% |
| Immigrants | Zaire | 0.0 /100 | #302 | Tragic 42.0% |