German Russian vs Tsimshian Single Father Households
COMPARE
German Russian
Tsimshian
Single Father Households
Single Father Households Comparison
German Russians
Tsimshian
2.4%
SINGLE FATHER HOUSEHOLDS
25.7/ 100
METRIC RATING
202nd/ 347
METRIC RANK
2.9%
SINGLE FATHER HOUSEHOLDS
0.0/ 100
METRIC RATING
312th/ 347
METRIC RANK
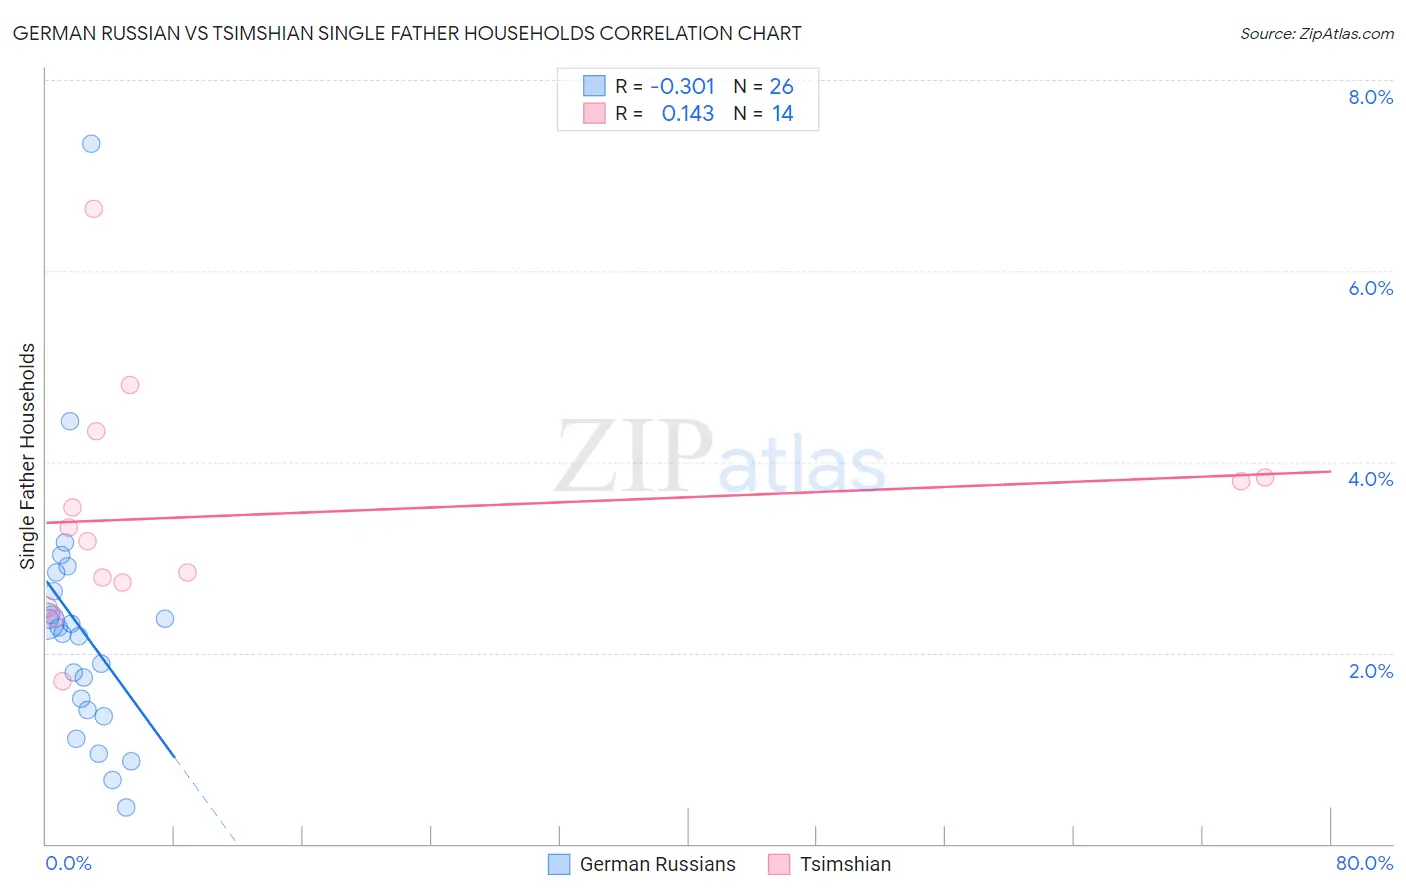
German Russian vs Tsimshian Single Father Households Correlation Chart
The statistical analysis conducted on geographies consisting of 96,318,608 people shows a mild negative correlation between the proportion of German Russians and percentage of single father households in the United States with a correlation coefficient (R) of -0.301 and weighted average of 2.4%. Similarly, the statistical analysis conducted on geographies consisting of 15,613,275 people shows a poor positive correlation between the proportion of Tsimshian and percentage of single father households in the United States with a correlation coefficient (R) of 0.143 and weighted average of 2.9%, a difference of 21.3%.
Single Father Households Correlation Summary
| Measurement | German Russian | Tsimshian |
| Minimum | 0.38% | 1.7% |
| Maximum | 7.3% | 6.6% |
| Range | 7.0% | 4.9% |
| Mean | 2.2% | 3.5% |
| Median | 2.2% | 3.2% |
| Interquartile 25% (IQ1) | 1.4% | 2.7% |
| Interquartile 75% (IQ3) | 2.7% | 3.8% |
| Interquartile Range (IQR) | 1.3% | 1.1% |
| Standard Deviation (Sample) | 1.4% | 1.2% |
| Standard Deviation (Population) | 1.3% | 1.2% |
Similar Demographics by Single Father Households
Demographics Similar to German Russians by Single Father Households
In terms of single father households, the demographic groups most similar to German Russians are Immigrants from Uganda (2.4%, a difference of 0.030%), French Canadian (2.4%, a difference of 0.10%), Ecuadorian (2.4%, a difference of 0.12%), Immigrants from Vietnam (2.4%, a difference of 0.13%), and Peruvian (2.4%, a difference of 0.13%).
| Demographics | Rating | Rank | Single Father Households |
| Immigrants | Philippines | 28.7 /100 | #195 | Fair 2.4% |
| Kenyans | 28.0 /100 | #196 | Fair 2.4% |
| Germans | 28.0 /100 | #197 | Fair 2.4% |
| Scandinavians | 27.4 /100 | #198 | Fair 2.4% |
| Immigrants | Vietnam | 27.1 /100 | #199 | Fair 2.4% |
| Peruvians | 27.1 /100 | #200 | Fair 2.4% |
| Immigrants | Uganda | 26.0 /100 | #201 | Fair 2.4% |
| German Russians | 25.7 /100 | #202 | Fair 2.4% |
| French Canadians | 24.7 /100 | #203 | Fair 2.4% |
| Ecuadorians | 24.5 /100 | #204 | Fair 2.4% |
| Immigrants | Afghanistan | 24.2 /100 | #205 | Fair 2.4% |
| Koreans | 24.1 /100 | #206 | Fair 2.4% |
| Whites/Caucasians | 22.6 /100 | #207 | Fair 2.4% |
| Immigrants | Kenya | 20.3 /100 | #208 | Fair 2.4% |
| Immigrants | Peru | 19.3 /100 | #209 | Poor 2.4% |
Demographics Similar to Tsimshian by Single Father Households
In terms of single father households, the demographic groups most similar to Tsimshian are Arapaho (2.9%, a difference of 0.42%), Spanish American Indian (2.9%, a difference of 0.57%), Salvadoran (2.9%, a difference of 0.67%), Immigrants from Laos (2.9%, a difference of 1.1%), and Cheyenne (2.9%, a difference of 1.1%).
| Demographics | Rating | Rank | Single Father Households |
| Hispanics or Latinos | 0.0 /100 | #305 | Tragic 2.8% |
| Immigrants | Azores | 0.0 /100 | #306 | Tragic 2.8% |
| Hopi | 0.0 /100 | #307 | Tragic 2.8% |
| Apache | 0.0 /100 | #308 | Tragic 2.8% |
| Central Americans | 0.0 /100 | #309 | Tragic 2.9% |
| Immigrants | Laos | 0.0 /100 | #310 | Tragic 2.9% |
| Spanish American Indians | 0.0 /100 | #311 | Tragic 2.9% |
| Tsimshian | 0.0 /100 | #312 | Tragic 2.9% |
| Arapaho | 0.0 /100 | #313 | Tragic 2.9% |
| Salvadorans | 0.0 /100 | #314 | Tragic 2.9% |
| Cheyenne | 0.0 /100 | #315 | Tragic 2.9% |
| Houma | 0.0 /100 | #316 | Tragic 2.9% |
| Immigrants | El Salvador | 0.0 /100 | #317 | Tragic 2.9% |
| Cape Verdeans | 0.0 /100 | #318 | Tragic 2.9% |
| Ute | 0.0 /100 | #319 | Tragic 3.0% |