Immigrants from Western Asia vs Immigrants from Korea Divorced or Separated
COMPARE
Immigrants from Western Asia
Immigrants from Korea
Divorced or Separated
Divorced or Separated Comparison
Immigrants from Western Asia
Immigrants from Korea
11.2%
DIVORCED OR SEPARATED
100.0/ 100
METRIC RATING
44th/ 347
METRIC RANK
10.6%
DIVORCED OR SEPARATED
100.0/ 100
METRIC RATING
16th/ 347
METRIC RANK
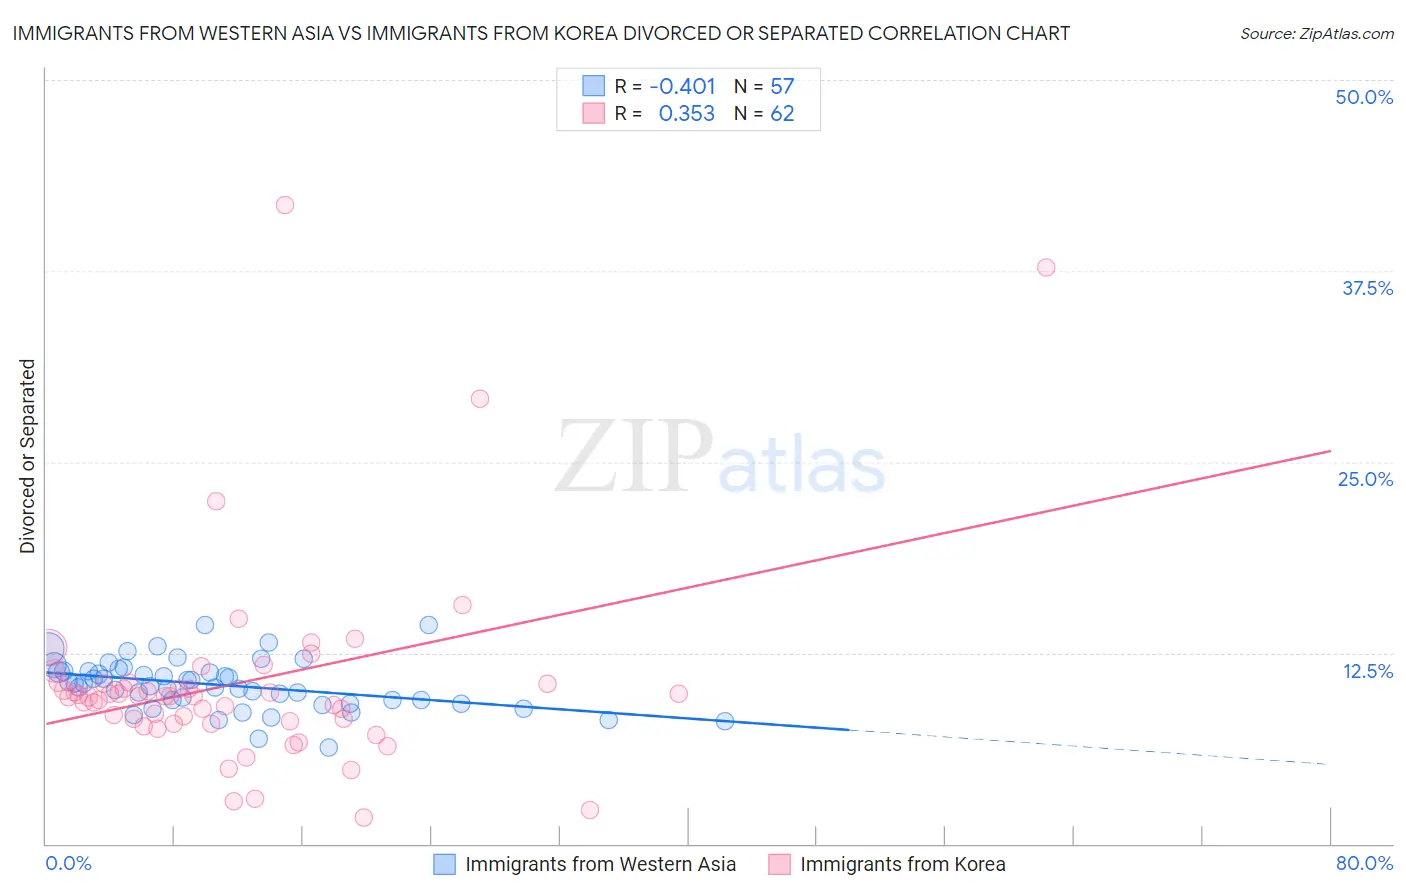
Immigrants from Western Asia vs Immigrants from Korea Divorced or Separated Correlation Chart
The statistical analysis conducted on geographies consisting of 404,250,440 people shows a moderate negative correlation between the proportion of Immigrants from Western Asia and percentage of population currently divorced or separated in the United States with a correlation coefficient (R) of -0.401 and weighted average of 11.2%. Similarly, the statistical analysis conducted on geographies consisting of 416,074,858 people shows a mild positive correlation between the proportion of Immigrants from Korea and percentage of population currently divorced or separated in the United States with a correlation coefficient (R) of 0.353 and weighted average of 10.6%, a difference of 5.4%.
Divorced or Separated Correlation Summary
| Measurement | Immigrants from Western Asia | Immigrants from Korea |
| Minimum | 6.3% | 1.7% |
| Maximum | 14.4% | 41.8% |
| Range | 8.1% | 40.1% |
| Mean | 10.4% | 10.5% |
| Median | 10.5% | 9.6% |
| Interquartile 25% (IQ1) | 9.3% | 8.0% |
| Interquartile 75% (IQ3) | 11.3% | 10.5% |
| Interquartile Range (IQR) | 2.0% | 2.5% |
| Standard Deviation (Sample) | 1.6% | 6.7% |
| Standard Deviation (Population) | 1.6% | 6.7% |
Similar Demographics by Divorced or Separated
Demographics Similar to Immigrants from Western Asia by Divorced or Separated
In terms of divorced or separated, the demographic groups most similar to Immigrants from Western Asia are Immigrants from Belarus (11.2%, a difference of 0.010%), Chinese (11.2%, a difference of 0.020%), Turkish (11.2%, a difference of 0.050%), Bhutanese (11.2%, a difference of 0.090%), and Laotian (11.2%, a difference of 0.16%).
| Demographics | Rating | Rank | Divorced or Separated |
| Immigrants | Lebanon | 100.0 /100 | #37 | Exceptional 11.1% |
| Immigrants | Greece | 100.0 /100 | #38 | Exceptional 11.1% |
| Immigrants | Egypt | 100.0 /100 | #39 | Exceptional 11.1% |
| Soviet Union | 100.0 /100 | #40 | Exceptional 11.1% |
| Bhutanese | 100.0 /100 | #41 | Exceptional 11.2% |
| Chinese | 100.0 /100 | #42 | Exceptional 11.2% |
| Immigrants | Belarus | 100.0 /100 | #43 | Exceptional 11.2% |
| Immigrants | Western Asia | 100.0 /100 | #44 | Exceptional 11.2% |
| Turks | 100.0 /100 | #45 | Exceptional 11.2% |
| Laotians | 100.0 /100 | #46 | Exceptional 11.2% |
| Immigrants | Poland | 100.0 /100 | #47 | Exceptional 11.2% |
| Immigrants | Turkey | 100.0 /100 | #48 | Exceptional 11.2% |
| Immigrants | Saudi Arabia | 100.0 /100 | #49 | Exceptional 11.2% |
| Bolivians | 100.0 /100 | #50 | Exceptional 11.2% |
| Immigrants | Bolivia | 100.0 /100 | #51 | Exceptional 11.3% |
Demographics Similar to Immigrants from Korea by Divorced or Separated
In terms of divorced or separated, the demographic groups most similar to Immigrants from Korea are Immigrants from Israel (10.6%, a difference of 0.10%), Immigrants from Iran (10.6%, a difference of 0.19%), Asian (10.6%, a difference of 0.20%), Immigrants from Armenia (10.6%, a difference of 0.44%), and Assyrian/Chaldean/Syriac (10.6%, a difference of 0.51%).
| Demographics | Rating | Rank | Divorced or Separated |
| Yup'ik | 100.0 /100 | #9 | Exceptional 10.3% |
| Immigrants | Singapore | 100.0 /100 | #10 | Exceptional 10.3% |
| Immigrants | South Central Asia | 100.0 /100 | #11 | Exceptional 10.4% |
| Okinawans | 100.0 /100 | #12 | Exceptional 10.5% |
| Cypriots | 100.0 /100 | #13 | Exceptional 10.5% |
| Assyrians/Chaldeans/Syriacs | 100.0 /100 | #14 | Exceptional 10.6% |
| Immigrants | Armenia | 100.0 /100 | #15 | Exceptional 10.6% |
| Immigrants | Korea | 100.0 /100 | #16 | Exceptional 10.6% |
| Immigrants | Israel | 100.0 /100 | #17 | Exceptional 10.6% |
| Immigrants | Iran | 100.0 /100 | #18 | Exceptional 10.6% |
| Asians | 100.0 /100 | #19 | Exceptional 10.6% |
| Burmese | 100.0 /100 | #20 | Exceptional 10.7% |
| Immigrants | Asia | 100.0 /100 | #21 | Exceptional 10.7% |
| Vietnamese | 100.0 /100 | #22 | Exceptional 10.8% |
| Immigrants | Pakistan | 100.0 /100 | #23 | Exceptional 10.8% |