Hawaiian vs Ecuadorian Divorced or Separated
COMPARE
Hawaiian
Ecuadorian
Divorced or Separated
Divorced or Separated Comparison
Hawaiians
Ecuadorians
12.1%
DIVORCED OR SEPARATED
50.0/ 100
METRIC RATING
174th/ 347
METRIC RANK
11.7%
DIVORCED OR SEPARATED
95.3/ 100
METRIC RATING
118th/ 347
METRIC RANK
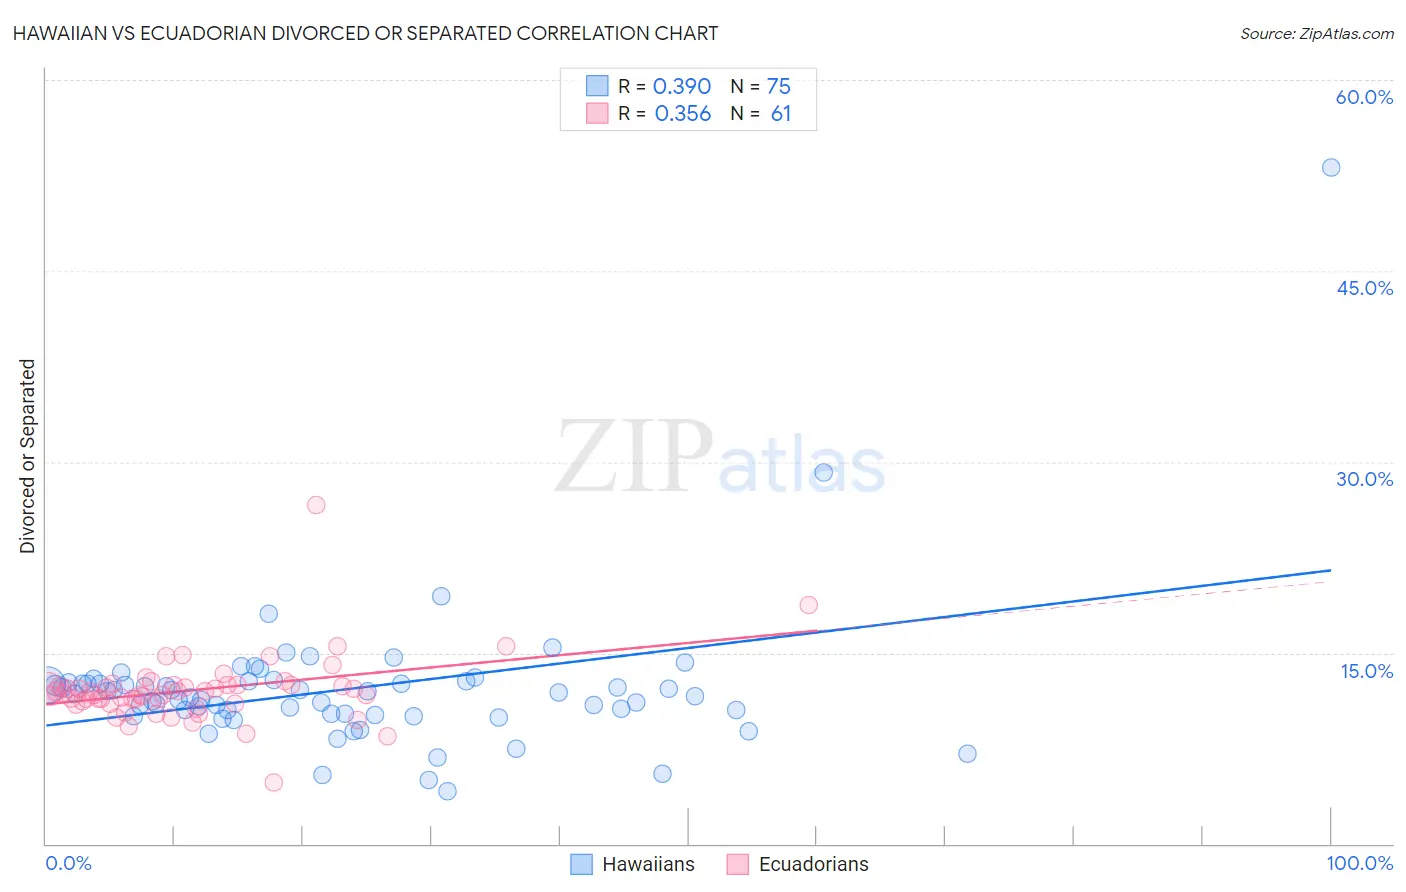
Hawaiian vs Ecuadorian Divorced or Separated Correlation Chart
The statistical analysis conducted on geographies consisting of 327,516,248 people shows a mild positive correlation between the proportion of Hawaiians and percentage of population currently divorced or separated in the United States with a correlation coefficient (R) of 0.390 and weighted average of 12.1%. Similarly, the statistical analysis conducted on geographies consisting of 317,712,201 people shows a mild positive correlation between the proportion of Ecuadorians and percentage of population currently divorced or separated in the United States with a correlation coefficient (R) of 0.356 and weighted average of 11.7%, a difference of 2.7%.
Divorced or Separated Correlation Summary
| Measurement | Hawaiian | Ecuadorian |
| Minimum | 4.1% | 4.8% |
| Maximum | 53.1% | 26.6% |
| Range | 49.0% | 21.8% |
| Mean | 12.1% | 12.1% |
| Median | 11.8% | 11.8% |
| Interquartile 25% (IQ1) | 10.2% | 11.1% |
| Interquartile 75% (IQ3) | 12.7% | 12.5% |
| Interquartile Range (IQR) | 2.5% | 1.4% |
| Standard Deviation (Sample) | 5.8% | 2.7% |
| Standard Deviation (Population) | 5.8% | 2.7% |
Similar Demographics by Divorced or Separated
Demographics Similar to Hawaiians by Divorced or Separated
In terms of divorced or separated, the demographic groups most similar to Hawaiians are Immigrants from Sierra Leone (12.1%, a difference of 0.0%), Immigrants from Moldova (12.1%, a difference of 0.020%), Pennsylvania German (12.1%, a difference of 0.040%), Brazilian (12.1%, a difference of 0.080%), and Immigrants from Mexico (12.0%, a difference of 0.11%).
| Demographics | Rating | Rank | Divorced or Separated |
| Ethiopians | 58.5 /100 | #167 | Average 12.0% |
| Serbians | 57.1 /100 | #168 | Average 12.0% |
| Immigrants | Peru | 57.0 /100 | #169 | Average 12.0% |
| Mexican American Indians | 55.8 /100 | #170 | Average 12.0% |
| Costa Ricans | 53.3 /100 | #171 | Average 12.0% |
| Immigrants | Mexico | 53.2 /100 | #172 | Average 12.0% |
| Immigrants | Moldova | 50.4 /100 | #173 | Average 12.1% |
| Hawaiians | 50.0 /100 | #174 | Average 12.1% |
| Immigrants | Sierra Leone | 50.0 /100 | #175 | Average 12.1% |
| Pennsylvania Germans | 48.9 /100 | #176 | Average 12.1% |
| Brazilians | 47.7 /100 | #177 | Average 12.1% |
| Ghanaians | 45.9 /100 | #178 | Average 12.1% |
| Immigrants | Western Europe | 45.6 /100 | #179 | Average 12.1% |
| Barbadians | 45.0 /100 | #180 | Average 12.1% |
| Immigrants | Canada | 44.0 /100 | #181 | Average 12.1% |
Demographics Similar to Ecuadorians by Divorced or Separated
In terms of divorced or separated, the demographic groups most similar to Ecuadorians are Immigrants from Uganda (11.7%, a difference of 0.0%), Immigrants from Iraq (11.7%, a difference of 0.020%), Syrian (11.7%, a difference of 0.040%), Lithuanian (11.7%, a difference of 0.090%), and Iraqi (11.8%, a difference of 0.13%).
| Demographics | Rating | Rank | Divorced or Separated |
| Immigrants | Spain | 96.8 /100 | #111 | Exceptional 11.7% |
| Immigrants | France | 96.6 /100 | #112 | Exceptional 11.7% |
| Estonians | 96.6 /100 | #113 | Exceptional 11.7% |
| Immigrants | Norway | 95.9 /100 | #114 | Exceptional 11.7% |
| Lithuanians | 95.7 /100 | #115 | Exceptional 11.7% |
| Immigrants | Iraq | 95.4 /100 | #116 | Exceptional 11.7% |
| Immigrants | Uganda | 95.3 /100 | #117 | Exceptional 11.7% |
| Ecuadorians | 95.3 /100 | #118 | Exceptional 11.7% |
| Syrians | 95.1 /100 | #119 | Exceptional 11.7% |
| Iraqis | 94.6 /100 | #120 | Exceptional 11.8% |
| Romanians | 94.5 /100 | #121 | Exceptional 11.8% |
| Menominee | 93.8 /100 | #122 | Exceptional 11.8% |
| Immigrants | Immigrants | 93.7 /100 | #123 | Exceptional 11.8% |
| Ugandans | 93.1 /100 | #124 | Exceptional 11.8% |
| Ukrainians | 92.3 /100 | #125 | Exceptional 11.8% |