Immigrants from Kuwait vs Immigrants from Sierra Leone Single Mother Households
COMPARE
Immigrants from Kuwait
Immigrants from Sierra Leone
Single Mother Households
Single Mother Households Comparison
Immigrants from Kuwait
Immigrants from Sierra Leone
5.8%
SINGLE MOTHER HOUSEHOLDS
95.4/ 100
METRIC RATING
112th/ 347
METRIC RANK
7.7%
SINGLE MOTHER HOUSEHOLDS
0.0/ 100
METRIC RATING
280th/ 347
METRIC RANK
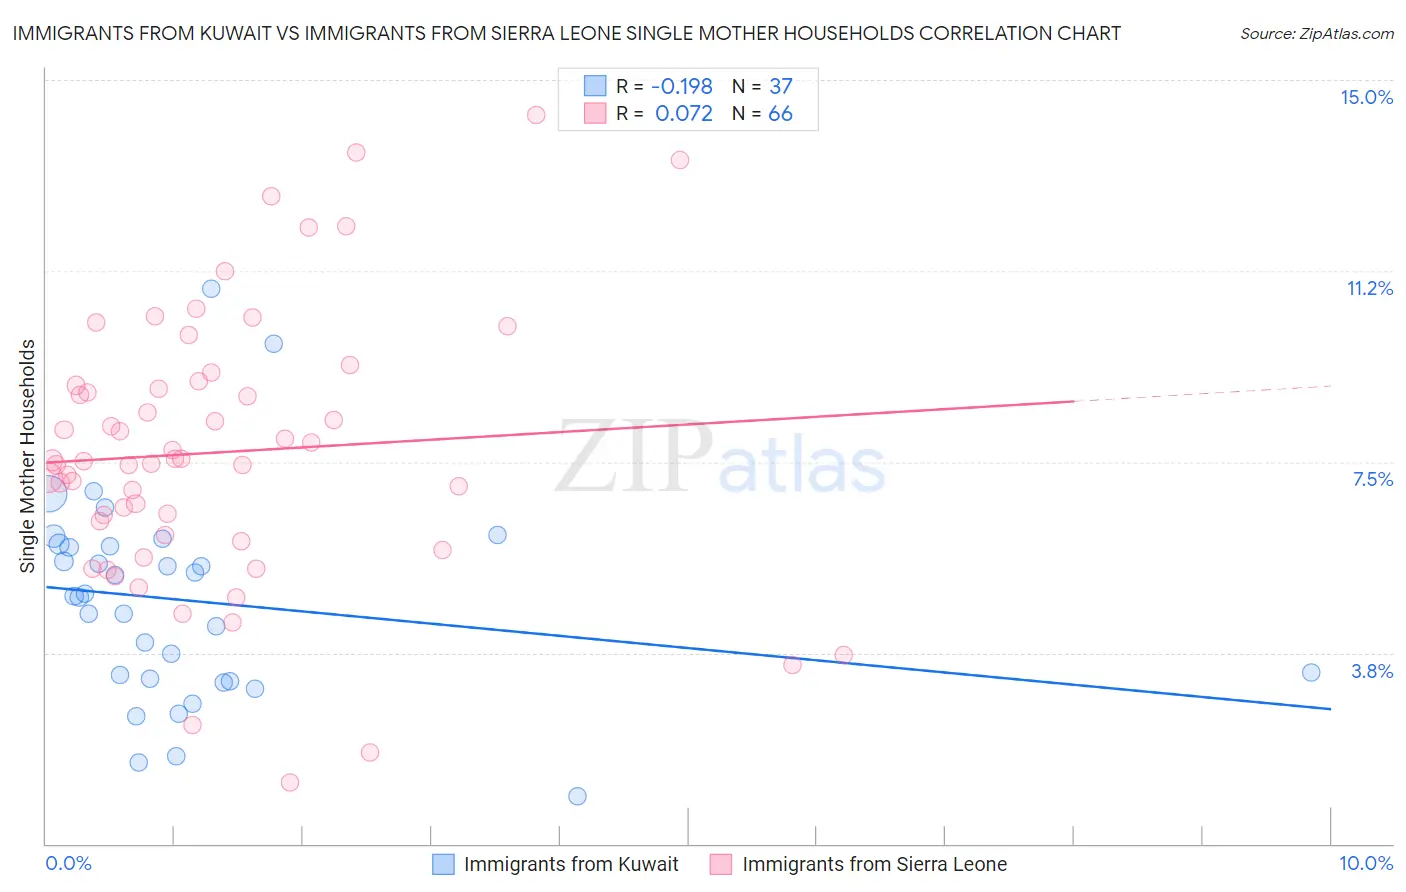
Immigrants from Kuwait vs Immigrants from Sierra Leone Single Mother Households Correlation Chart
The statistical analysis conducted on geographies consisting of 136,852,016 people shows a poor negative correlation between the proportion of Immigrants from Kuwait and percentage of single mother households in the United States with a correlation coefficient (R) of -0.198 and weighted average of 5.8%. Similarly, the statistical analysis conducted on geographies consisting of 101,563,361 people shows a slight positive correlation between the proportion of Immigrants from Sierra Leone and percentage of single mother households in the United States with a correlation coefficient (R) of 0.072 and weighted average of 7.7%, a difference of 32.4%.
Single Mother Households Correlation Summary
| Measurement | Immigrants from Kuwait | Immigrants from Sierra Leone |
| Minimum | 0.94% | 1.2% |
| Maximum | 10.9% | 14.3% |
| Range | 10.0% | 13.1% |
| Mean | 4.8% | 7.7% |
| Median | 4.9% | 7.5% |
| Interquartile 25% (IQ1) | 3.2% | 6.1% |
| Interquartile 75% (IQ3) | 5.9% | 9.0% |
| Interquartile Range (IQR) | 2.6% | 3.0% |
| Standard Deviation (Sample) | 2.1% | 2.7% |
| Standard Deviation (Population) | 2.0% | 2.7% |
Similar Demographics by Single Mother Households
Demographics Similar to Immigrants from Kuwait by Single Mother Households
In terms of single mother households, the demographic groups most similar to Immigrants from Kuwait are Immigrants from England (5.8%, a difference of 0.040%), British (5.8%, a difference of 0.070%), Mongolian (5.8%, a difference of 0.070%), Immigrants from Western Europe (5.8%, a difference of 0.16%), and Dutch (5.8%, a difference of 0.20%).
| Demographics | Rating | Rank | Single Mother Households |
| Taiwanese | 96.1 /100 | #105 | Exceptional 5.8% |
| Immigrants | Ukraine | 95.9 /100 | #106 | Exceptional 5.8% |
| Paraguayans | 95.8 /100 | #107 | Exceptional 5.8% |
| Immigrants | Italy | 95.8 /100 | #108 | Exceptional 5.8% |
| Immigrants | Western Europe | 95.7 /100 | #109 | Exceptional 5.8% |
| British | 95.5 /100 | #110 | Exceptional 5.8% |
| Immigrants | England | 95.5 /100 | #111 | Exceptional 5.8% |
| Immigrants | Kuwait | 95.4 /100 | #112 | Exceptional 5.8% |
| Mongolians | 95.3 /100 | #113 | Exceptional 5.8% |
| Dutch | 95.1 /100 | #114 | Exceptional 5.8% |
| Irish | 94.8 /100 | #115 | Exceptional 5.8% |
| Pennsylvania Germans | 94.7 /100 | #116 | Exceptional 5.8% |
| Bolivians | 94.6 /100 | #117 | Exceptional 5.8% |
| Laotians | 94.3 /100 | #118 | Exceptional 5.8% |
| South Africans | 94.1 /100 | #119 | Exceptional 5.8% |
Demographics Similar to Immigrants from Sierra Leone by Single Mother Households
In terms of single mother households, the demographic groups most similar to Immigrants from Sierra Leone are Immigrants from Laos (7.7%, a difference of 0.0%), Guatemalan (7.7%, a difference of 0.020%), Nigerian (7.7%, a difference of 0.050%), Immigrants from El Salvador (7.6%, a difference of 0.52%), and Immigrants from Belize (7.7%, a difference of 0.65%).
| Demographics | Rating | Rank | Single Mother Households |
| Belizeans | 0.1 /100 | #273 | Tragic 7.6% |
| Immigrants | Guyana | 0.1 /100 | #274 | Tragic 7.6% |
| Central American Indians | 0.1 /100 | #275 | Tragic 7.6% |
| Guyanese | 0.1 /100 | #276 | Tragic 7.6% |
| Immigrants | Trinidad and Tobago | 0.1 /100 | #277 | Tragic 7.6% |
| Central Americans | 0.1 /100 | #278 | Tragic 7.6% |
| Immigrants | El Salvador | 0.0 /100 | #279 | Tragic 7.6% |
| Immigrants | Sierra Leone | 0.0 /100 | #280 | Tragic 7.7% |
| Immigrants | Laos | 0.0 /100 | #281 | Tragic 7.7% |
| Guatemalans | 0.0 /100 | #282 | Tragic 7.7% |
| Nigerians | 0.0 /100 | #283 | Tragic 7.7% |
| Immigrants | Belize | 0.0 /100 | #284 | Tragic 7.7% |
| Trinidadians and Tobagonians | 0.0 /100 | #285 | Tragic 7.7% |
| Immigrants | Middle Africa | 0.0 /100 | #286 | Tragic 7.7% |
| Immigrants | Guatemala | 0.0 /100 | #287 | Tragic 7.7% |