Immigrants from Venezuela vs Spanish American Average Family Size
COMPARE
Immigrants from Venezuela
Spanish American
Average Family Size
Average Family Size Comparison
Immigrants from Venezuela
Spanish Americans
3.26
AVERAGE FAMILY SIZE
86.3/ 100
METRIC RATING
133rd/ 347
METRIC RANK
3.24
AVERAGE FAMILY SIZE
72.5/ 100
METRIC RATING
152nd/ 347
METRIC RANK
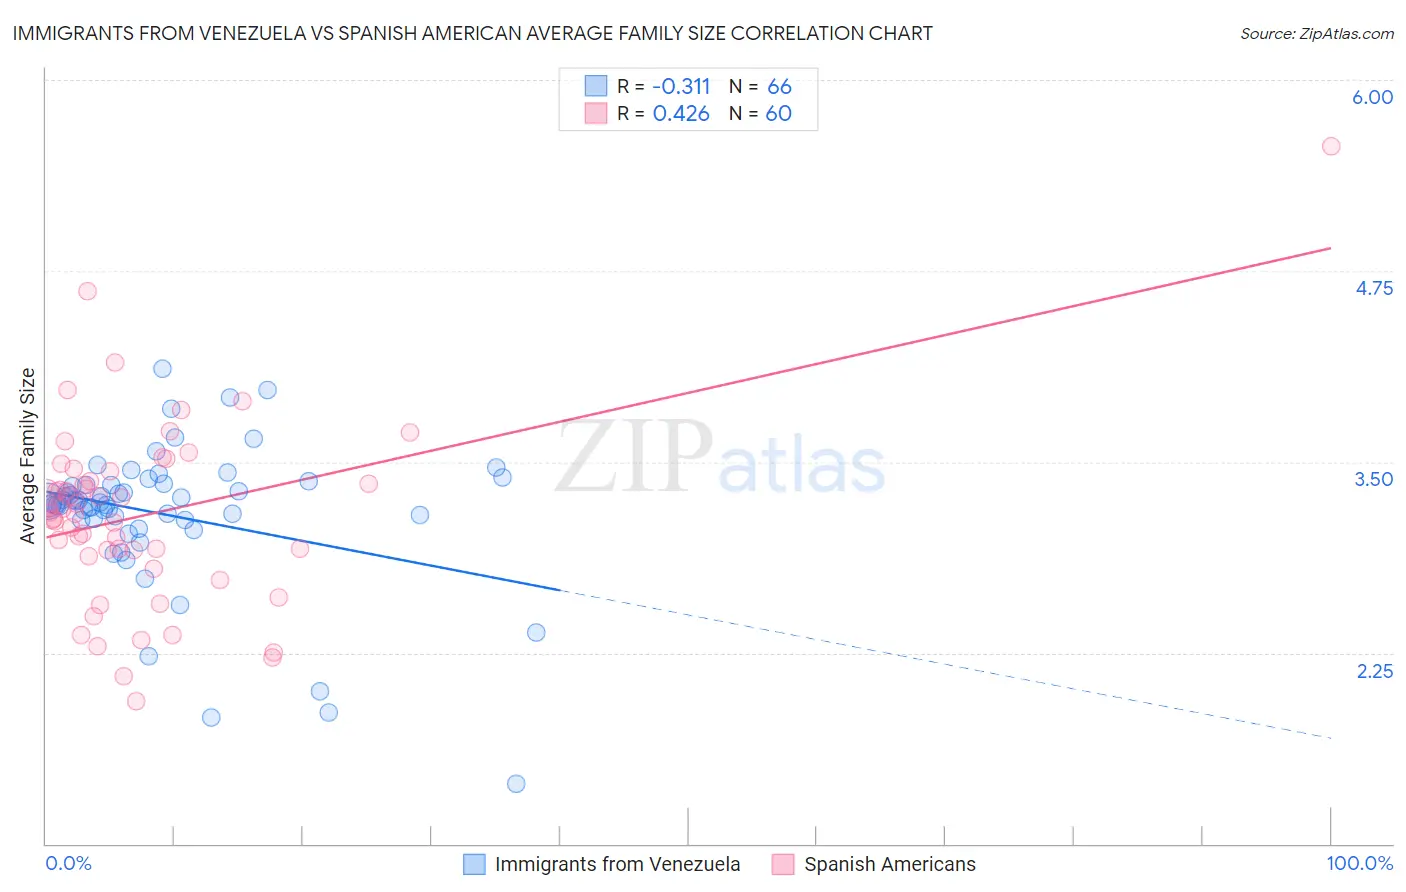
Immigrants from Venezuela vs Spanish American Average Family Size Correlation Chart
The statistical analysis conducted on geographies consisting of 287,786,704 people shows a mild negative correlation between the proportion of Immigrants from Venezuela and average family size in the United States with a correlation coefficient (R) of -0.311 and weighted average of 3.26. Similarly, the statistical analysis conducted on geographies consisting of 103,168,621 people shows a moderate positive correlation between the proportion of Spanish Americans and average family size in the United States with a correlation coefficient (R) of 0.426 and weighted average of 3.24, a difference of 0.39%.
Average Family Size Correlation Summary
| Measurement | Immigrants from Venezuela | Spanish American |
| Minimum | 1.39 | 1.93 |
| Maximum | 4.11 | 5.56 |
| Range | 2.72 | 3.63 |
| Mean | 3.16 | 3.15 |
| Median | 3.23 | 3.17 |
| Interquartile 25% (IQ1) | 3.12 | 2.90 |
| Interquartile 75% (IQ3) | 3.35 | 3.41 |
| Interquartile Range (IQR) | 0.23 | 0.51 |
| Standard Deviation (Sample) | 0.47 | 0.61 |
| Standard Deviation (Population) | 0.47 | 0.60 |
Demographics Similar to Immigrants from Venezuela and Spanish Americans by Average Family Size
In terms of average family size, the demographic groups most similar to Immigrants from Venezuela are Costa Rican (3.26, a difference of 0.020%), African (3.25, a difference of 0.050%), Panamanian (3.25, a difference of 0.070%), Comanche (3.25, a difference of 0.12%), and Immigrants from Middle Africa (3.25, a difference of 0.13%). Similarly, the demographic groups most similar to Spanish Americans are Jordanian (3.24, a difference of 0.020%), Assyrian/Chaldean/Syriac (3.24, a difference of 0.030%), Indian (Asian) (3.24, a difference of 0.030%), Blackfeet (3.24, a difference of 0.060%), and Immigrants from Jordan (3.24, a difference of 0.070%).
| Demographics | Rating | Rank | Average Family Size |
| Costa Ricans | 86.8 /100 | #132 | Excellent 3.26 |
| Immigrants | Venezuela | 86.3 /100 | #133 | Excellent 3.26 |
| Africans | 84.9 /100 | #134 | Excellent 3.25 |
| Panamanians | 84.2 /100 | #135 | Excellent 3.25 |
| Comanche | 82.8 /100 | #136 | Excellent 3.25 |
| Immigrants | Middle Africa | 82.4 /100 | #137 | Excellent 3.25 |
| Cubans | 81.8 /100 | #138 | Excellent 3.25 |
| Immigrants | Ethiopia | 81.6 /100 | #139 | Excellent 3.25 |
| Sub-Saharan Africans | 81.6 /100 | #140 | Excellent 3.25 |
| Venezuelans | 81.4 /100 | #141 | Excellent 3.25 |
| Liberians | 81.2 /100 | #142 | Excellent 3.25 |
| Bhutanese | 81.0 /100 | #143 | Excellent 3.25 |
| Tsimshian | 80.2 /100 | #144 | Excellent 3.25 |
| Armenians | 78.2 /100 | #145 | Good 3.25 |
| Immigrants | Africa | 77.9 /100 | #146 | Good 3.25 |
| Immigrants | Jordan | 75.7 /100 | #147 | Good 3.24 |
| Blackfeet | 75.0 /100 | #148 | Good 3.24 |
| Assyrians/Chaldeans/Syriacs | 73.8 /100 | #149 | Good 3.24 |
| Indians (Asian) | 73.6 /100 | #150 | Good 3.24 |
| Jordanians | 73.5 /100 | #151 | Good 3.24 |
| Spanish Americans | 72.5 /100 | #152 | Good 3.24 |