Immigrants from Uzbekistan vs Immigrants from Russia Single Father Households
COMPARE
Immigrants from Uzbekistan
Immigrants from Russia
Single Father Households
Single Father Households Comparison
Immigrants from Uzbekistan
Immigrants from Russia
1.8%
SINGLE FATHER HOUSEHOLDS
100.0/ 100
METRIC RATING
4th/ 347
METRIC RANK
2.0%
SINGLE FATHER HOUSEHOLDS
100.0/ 100
METRIC RATING
24th/ 347
METRIC RANK
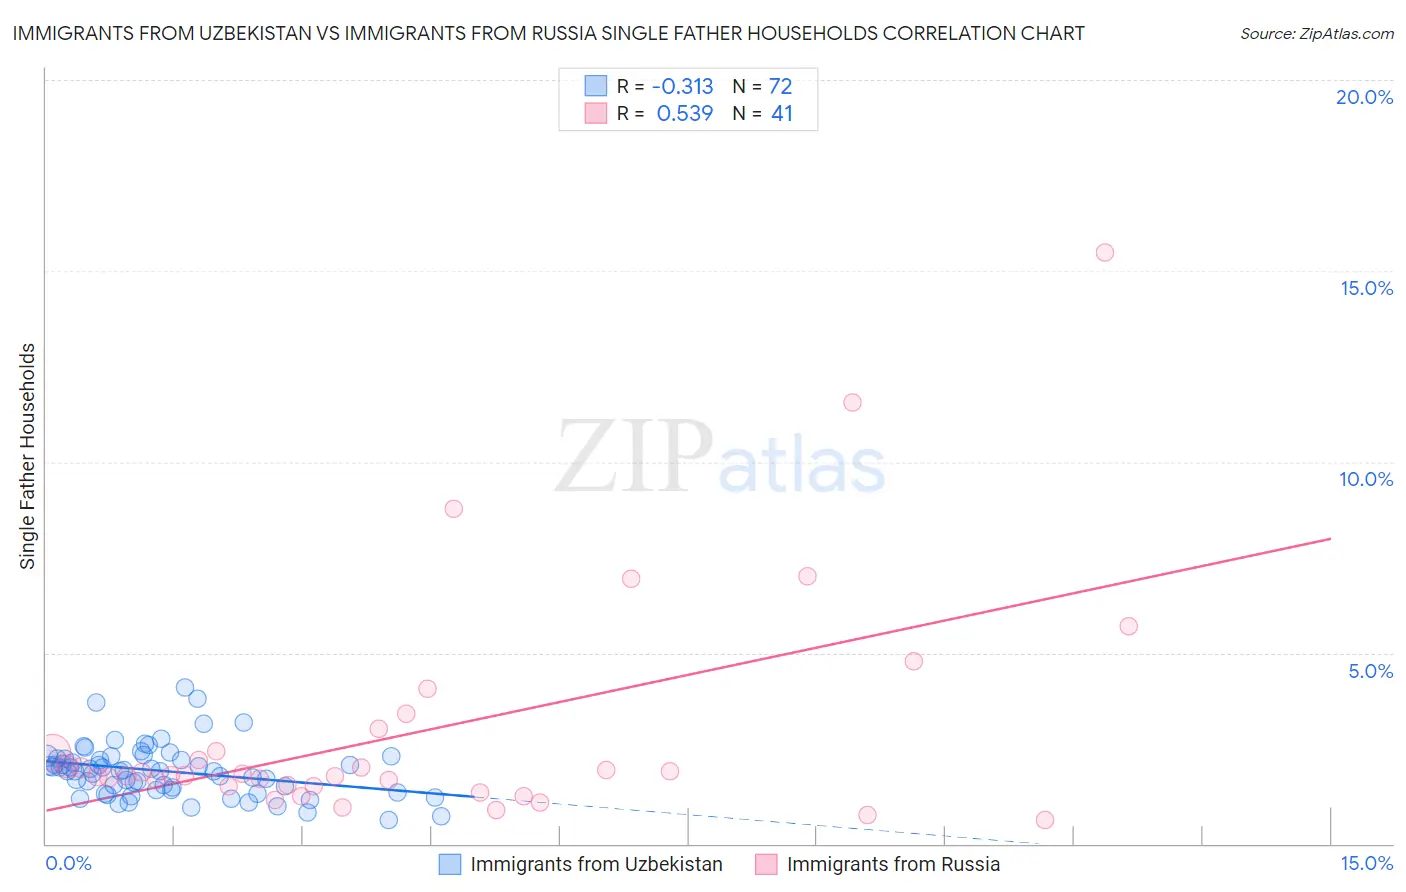
Immigrants from Uzbekistan vs Immigrants from Russia Single Father Households Correlation Chart
The statistical analysis conducted on geographies consisting of 118,416,914 people shows a mild negative correlation between the proportion of Immigrants from Uzbekistan and percentage of single father households in the United States with a correlation coefficient (R) of -0.313 and weighted average of 1.8%. Similarly, the statistical analysis conducted on geographies consisting of 345,238,184 people shows a substantial positive correlation between the proportion of Immigrants from Russia and percentage of single father households in the United States with a correlation coefficient (R) of 0.539 and weighted average of 2.0%, a difference of 7.8%.
Single Father Households Correlation Summary
| Measurement | Immigrants from Uzbekistan | Immigrants from Russia |
| Minimum | 0.62% | 0.62% |
| Maximum | 4.1% | 15.5% |
| Range | 3.5% | 14.8% |
| Mean | 1.9% | 2.9% |
| Median | 1.9% | 1.8% |
| Interquartile 25% (IQ1) | 1.4% | 1.5% |
| Interquartile 75% (IQ3) | 2.2% | 2.7% |
| Interquartile Range (IQR) | 0.82% | 1.2% |
| Standard Deviation (Sample) | 0.68% | 3.0% |
| Standard Deviation (Population) | 0.68% | 3.0% |
Demographics Similar to Immigrants from Uzbekistan and Immigrants from Russia by Single Father Households
In terms of single father households, the demographic groups most similar to Immigrants from Uzbekistan are Immigrants from Hong Kong (1.8%, a difference of 0.94%), Immigrants from Taiwan (1.8%, a difference of 1.3%), Cypriot (1.8%, a difference of 1.5%), Immigrants from Ireland (1.8%, a difference of 1.6%), and Immigrants from China (1.8%, a difference of 1.7%). Similarly, the demographic groups most similar to Immigrants from Russia are Immigrants from Croatia (2.0%, a difference of 0.0%), Immigrants from Latvia (1.9%, a difference of 1.2%), Immigrants from Albania (1.9%, a difference of 1.4%), Thai (1.9%, a difference of 1.7%), and Iranian (1.9%, a difference of 1.8%).
| Demographics | Rating | Rank | Single Father Households |
| Immigrants | Uzbekistan | 100.0 /100 | #4 | Exceptional 1.8% |
| Immigrants | Hong Kong | 100.0 /100 | #5 | Exceptional 1.8% |
| Immigrants | Taiwan | 100.0 /100 | #6 | Exceptional 1.8% |
| Cypriots | 100.0 /100 | #7 | Exceptional 1.8% |
| Immigrants | Ireland | 100.0 /100 | #8 | Exceptional 1.8% |
| Immigrants | China | 100.0 /100 | #9 | Exceptional 1.8% |
| Okinawans | 100.0 /100 | #10 | Exceptional 1.9% |
| Immigrants | Belarus | 100.0 /100 | #11 | Exceptional 1.9% |
| Immigrants | Greece | 100.0 /100 | #12 | Exceptional 1.9% |
| Immigrants | Singapore | 100.0 /100 | #13 | Exceptional 1.9% |
| Immigrants | Lithuania | 100.0 /100 | #14 | Exceptional 1.9% |
| Immigrants | Eastern Asia | 100.0 /100 | #15 | Exceptional 1.9% |
| Immigrants | Iran | 100.0 /100 | #16 | Exceptional 1.9% |
| Immigrants | India | 100.0 /100 | #17 | Exceptional 1.9% |
| Indians (Asian) | 100.0 /100 | #18 | Exceptional 1.9% |
| Iranians | 100.0 /100 | #19 | Exceptional 1.9% |
| Thais | 100.0 /100 | #20 | Exceptional 1.9% |
| Immigrants | Albania | 100.0 /100 | #21 | Exceptional 1.9% |
| Immigrants | Latvia | 100.0 /100 | #22 | Exceptional 1.9% |
| Immigrants | Croatia | 100.0 /100 | #23 | Exceptional 2.0% |
| Immigrants | Russia | 100.0 /100 | #24 | Exceptional 2.0% |