Immigrants from Uruguay vs Soviet Union Family Households with Children
COMPARE
Immigrants from Uruguay
Soviet Union
Family Households with Children
Family Households with Children Comparison
Immigrants from Uruguay
Soviet Union
27.4%
FAMILY HOUSEHOLDS WITH CHILDREN
37.7/ 100
METRIC RATING
190th/ 347
METRIC RANK
24.8%
FAMILY HOUSEHOLDS WITH CHILDREN
0.0/ 100
METRIC RATING
347th/ 347
METRIC RANK
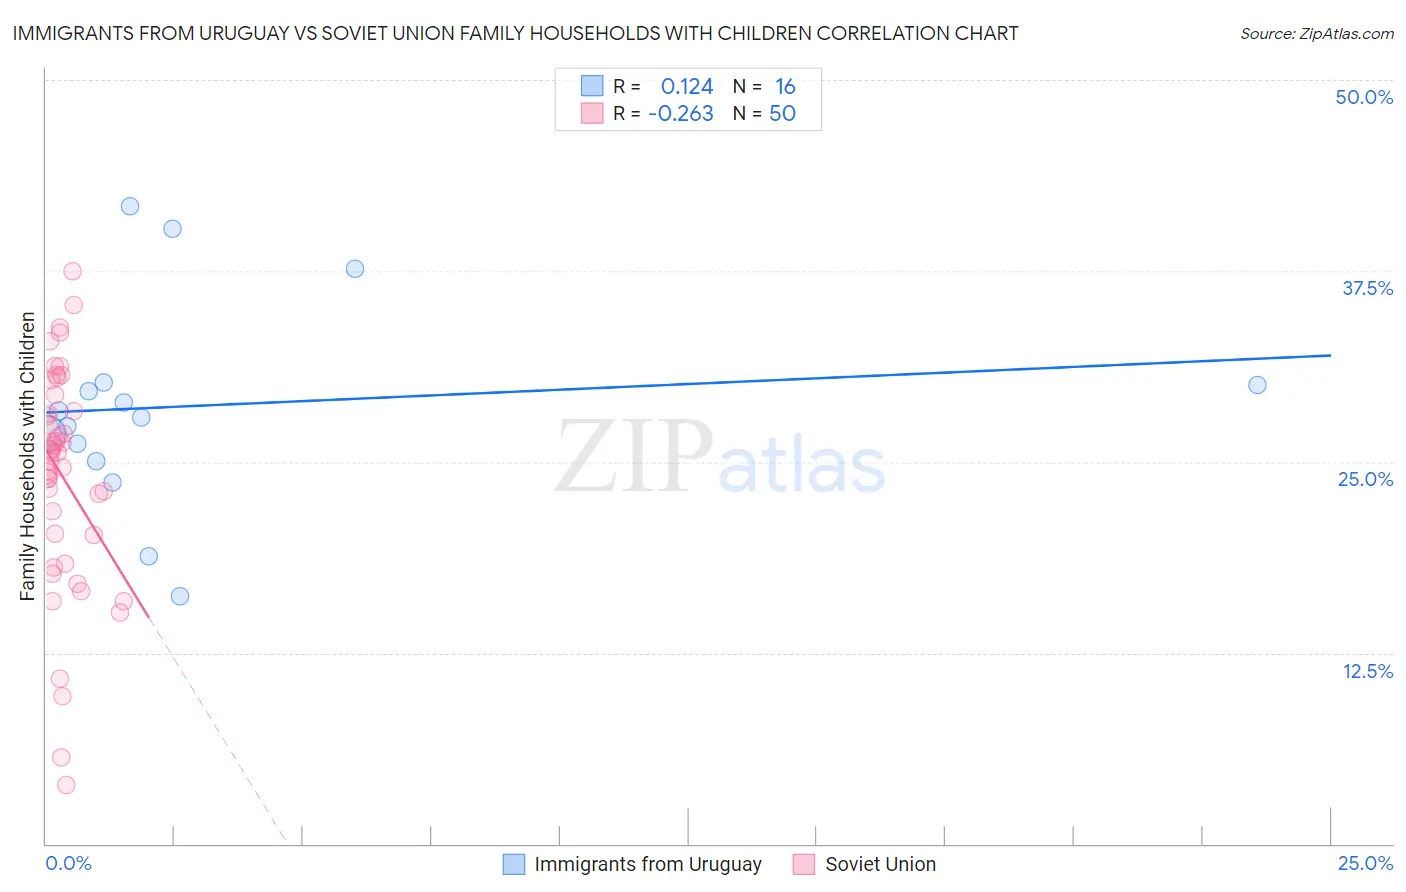
Immigrants from Uruguay vs Soviet Union Family Households with Children Correlation Chart
The statistical analysis conducted on geographies consisting of 133,231,566 people shows a poor positive correlation between the proportion of Immigrants from Uruguay and percentage of family households with children in the United States with a correlation coefficient (R) of 0.124 and weighted average of 27.4%. Similarly, the statistical analysis conducted on geographies consisting of 43,507,207 people shows a weak negative correlation between the proportion of Soviet Union and percentage of family households with children in the United States with a correlation coefficient (R) of -0.263 and weighted average of 24.8%, a difference of 10.2%.
Family Households with Children Correlation Summary
| Measurement | Immigrants from Uruguay | Soviet Union |
| Minimum | 16.2% | 3.9% |
| Maximum | 41.7% | 37.4% |
| Range | 25.5% | 33.6% |
| Mean | 28.7% | 24.0% |
| Median | 28.1% | 25.6% |
| Interquartile 25% (IQ1) | 25.6% | 20.2% |
| Interquartile 75% (IQ3) | 30.1% | 28.3% |
| Interquartile Range (IQR) | 4.5% | 8.1% |
| Standard Deviation (Sample) | 6.8% | 7.2% |
| Standard Deviation (Population) | 6.6% | 7.2% |
Similar Demographics by Family Households with Children
Demographics Similar to Immigrants from Uruguay by Family Households with Children
In terms of family households with children, the demographic groups most similar to Immigrants from Uruguay are Sudanese (27.4%, a difference of 0.0%), Pennsylvania German (27.4%, a difference of 0.0%), Immigrants from Israel (27.4%, a difference of 0.010%), Swedish (27.4%, a difference of 0.020%), and Dutch (27.4%, a difference of 0.030%).
| Demographics | Rating | Rank | Family Households with Children |
| South Africans | 44.9 /100 | #183 | Average 27.4% |
| Native Hawaiians | 44.6 /100 | #184 | Average 27.4% |
| Delaware | 42.0 /100 | #185 | Average 27.4% |
| Immigrants | Brazil | 40.6 /100 | #186 | Average 27.4% |
| Creek | 39.8 /100 | #187 | Fair 27.4% |
| Dutch | 38.8 /100 | #188 | Fair 27.4% |
| Immigrants | Israel | 37.9 /100 | #189 | Fair 27.4% |
| Immigrants | Uruguay | 37.7 /100 | #190 | Fair 27.4% |
| Sudanese | 37.6 /100 | #191 | Fair 27.4% |
| Pennsylvania Germans | 37.5 /100 | #192 | Fair 27.4% |
| Swedes | 36.9 /100 | #193 | Fair 27.4% |
| Immigrants | Iran | 36.1 /100 | #194 | Fair 27.4% |
| Crow | 35.7 /100 | #195 | Fair 27.4% |
| Cheyenne | 35.1 /100 | #196 | Fair 27.4% |
| Norwegians | 35.0 /100 | #197 | Fair 27.4% |
Demographics Similar to Soviet Union by Family Households with Children
In terms of family households with children, the demographic groups most similar to Soviet Union are Immigrants from Grenada (25.2%, a difference of 1.3%), Carpatho Rusyn (25.2%, a difference of 1.3%), Pueblo (25.2%, a difference of 1.5%), Hopi (25.2%, a difference of 1.6%), and Alsatian (25.3%, a difference of 1.8%).
| Demographics | Rating | Rank | Family Households with Children |
| Immigrants | Switzerland | 0.0 /100 | #333 | Tragic 25.7% |
| Slovaks | 0.0 /100 | #334 | Tragic 25.7% |
| Immigrants | Croatia | 0.0 /100 | #335 | Tragic 25.7% |
| Immigrants | West Indies | 0.0 /100 | #336 | Tragic 25.7% |
| Puerto Ricans | 0.0 /100 | #337 | Tragic 25.6% |
| Arapaho | 0.0 /100 | #338 | Tragic 25.6% |
| Immigrants | St. Vincent and the Grenadines | 0.0 /100 | #339 | Tragic 25.6% |
| Immigrants | Armenia | 0.0 /100 | #340 | Tragic 25.6% |
| Immigrants | Serbia | 0.0 /100 | #341 | Tragic 25.5% |
| Alsatians | 0.0 /100 | #342 | Tragic 25.3% |
| Hopi | 0.0 /100 | #343 | Tragic 25.2% |
| Pueblo | 0.0 /100 | #344 | Tragic 25.2% |
| Immigrants | Grenada | 0.0 /100 | #345 | Tragic 25.2% |
| Carpatho Rusyns | 0.0 /100 | #346 | Tragic 25.2% |
| Soviet Union | 0.0 /100 | #347 | Tragic 24.8% |