Arapaho vs Norwegian Single Father Households
COMPARE
Arapaho
Norwegian
Single Father Households
Single Father Households Comparison
Arapaho
Norwegians
2.9%
SINGLE FATHER HOUSEHOLDS
0.0/ 100
METRIC RATING
313th/ 347
METRIC RANK
2.4%
SINGLE FATHER HOUSEHOLDS
17.1/ 100
METRIC RATING
213th/ 347
METRIC RANK
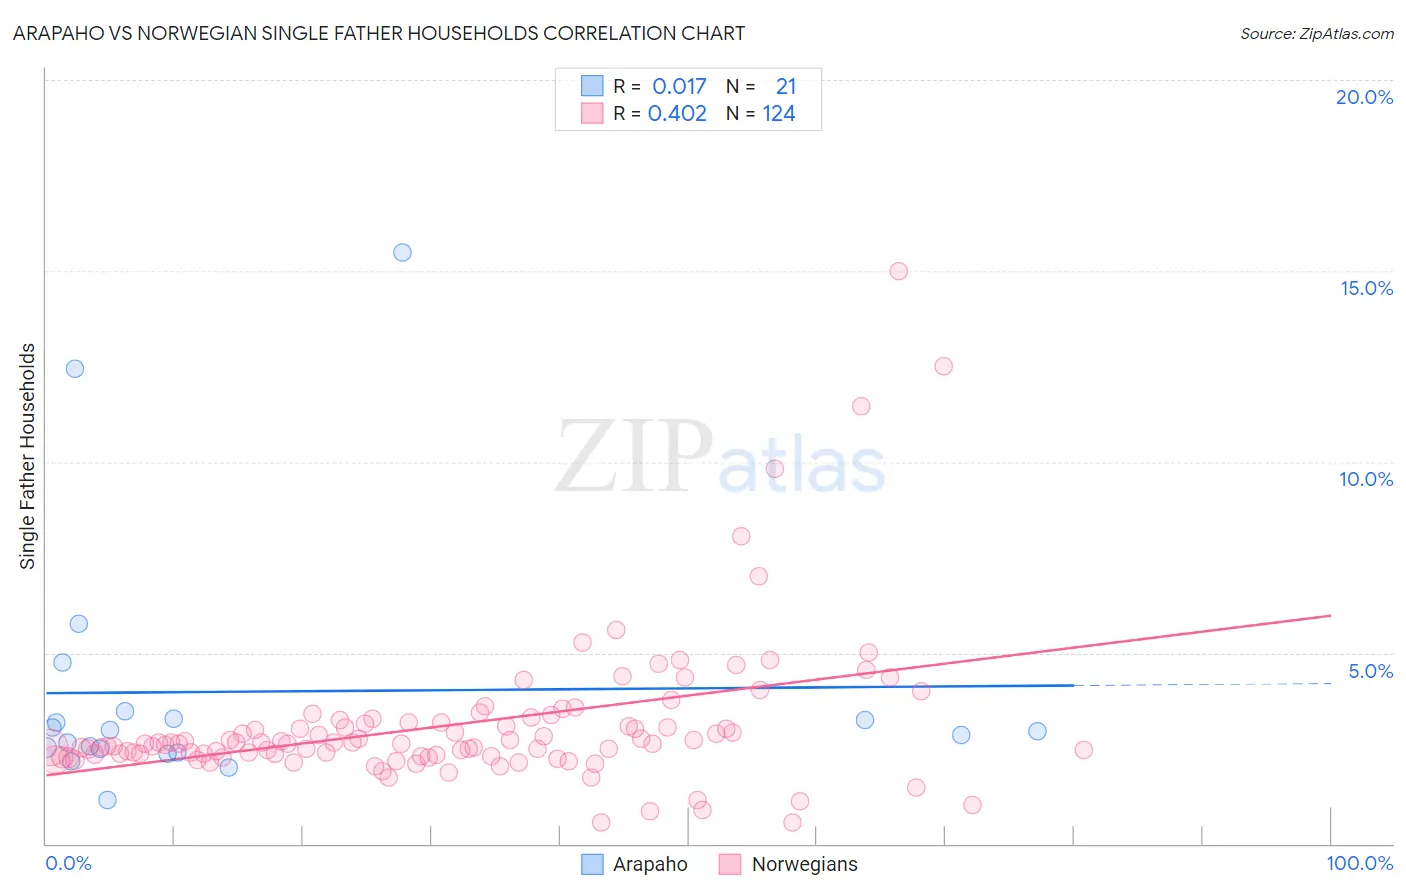
Arapaho vs Norwegian Single Father Households Correlation Chart
The statistical analysis conducted on geographies consisting of 29,720,466 people shows no correlation between the proportion of Arapaho and percentage of single father households in the United States with a correlation coefficient (R) of 0.017 and weighted average of 2.9%. Similarly, the statistical analysis conducted on geographies consisting of 522,435,304 people shows a moderate positive correlation between the proportion of Norwegians and percentage of single father households in the United States with a correlation coefficient (R) of 0.402 and weighted average of 2.4%, a difference of 20.6%.
Single Father Households Correlation Summary
| Measurement | Arapaho | Norwegian |
| Minimum | 1.1% | 0.55% |
| Maximum | 15.5% | 15.0% |
| Range | 14.4% | 14.5% |
| Mean | 4.0% | 3.1% |
| Median | 3.0% | 2.6% |
| Interquartile 25% (IQ1) | 2.4% | 2.3% |
| Interquartile 75% (IQ3) | 3.4% | 3.2% |
| Interquartile Range (IQR) | 0.93% | 0.86% |
| Standard Deviation (Sample) | 3.5% | 2.0% |
| Standard Deviation (Population) | 3.4% | 2.0% |
Similar Demographics by Single Father Households
Demographics Similar to Arapaho by Single Father Households
In terms of single father households, the demographic groups most similar to Arapaho are Salvadoran (2.9%, a difference of 0.25%), Tsimshian (2.9%, a difference of 0.42%), Cheyenne (2.9%, a difference of 0.64%), Houma (2.9%, a difference of 0.64%), and Spanish American Indian (2.9%, a difference of 0.99%).
| Demographics | Rating | Rank | Single Father Households |
| Immigrants | Azores | 0.0 /100 | #306 | Tragic 2.8% |
| Hopi | 0.0 /100 | #307 | Tragic 2.8% |
| Apache | 0.0 /100 | #308 | Tragic 2.8% |
| Central Americans | 0.0 /100 | #309 | Tragic 2.9% |
| Immigrants | Laos | 0.0 /100 | #310 | Tragic 2.9% |
| Spanish American Indians | 0.0 /100 | #311 | Tragic 2.9% |
| Tsimshian | 0.0 /100 | #312 | Tragic 2.9% |
| Arapaho | 0.0 /100 | #313 | Tragic 2.9% |
| Salvadorans | 0.0 /100 | #314 | Tragic 2.9% |
| Cheyenne | 0.0 /100 | #315 | Tragic 2.9% |
| Houma | 0.0 /100 | #316 | Tragic 2.9% |
| Immigrants | El Salvador | 0.0 /100 | #317 | Tragic 2.9% |
| Cape Verdeans | 0.0 /100 | #318 | Tragic 2.9% |
| Ute | 0.0 /100 | #319 | Tragic 3.0% |
| Guatemalans | 0.0 /100 | #320 | Tragic 3.0% |
Demographics Similar to Norwegians by Single Father Households
In terms of single father households, the demographic groups most similar to Norwegians are Ethiopian (2.4%, a difference of 0.060%), Finnish (2.4%, a difference of 0.15%), Immigrants from South Eastern Asia (2.4%, a difference of 0.16%), Immigrants from Nigeria (2.4%, a difference of 0.20%), and Immigrants from Costa Rica (2.4%, a difference of 0.25%).
| Demographics | Rating | Rank | Single Father Households |
| Koreans | 24.1 /100 | #206 | Fair 2.4% |
| Whites/Caucasians | 22.6 /100 | #207 | Fair 2.4% |
| Immigrants | Kenya | 20.3 /100 | #208 | Fair 2.4% |
| Immigrants | Peru | 19.3 /100 | #209 | Poor 2.4% |
| Immigrants | Costa Rica | 19.2 /100 | #210 | Poor 2.4% |
| Immigrants | Nigeria | 18.7 /100 | #211 | Poor 2.4% |
| Finns | 18.3 /100 | #212 | Poor 2.4% |
| Norwegians | 17.1 /100 | #213 | Poor 2.4% |
| Ethiopians | 16.6 /100 | #214 | Poor 2.4% |
| Immigrants | South Eastern Asia | 15.9 /100 | #215 | Poor 2.4% |
| Immigrants | Ecuador | 14.9 /100 | #216 | Poor 2.4% |
| Dutch | 14.3 /100 | #217 | Poor 2.4% |
| Immigrants | Ethiopia | 13.4 /100 | #218 | Poor 2.4% |
| Sudanese | 13.0 /100 | #219 | Poor 2.4% |
| Ghanaians | 12.9 /100 | #220 | Poor 2.4% |