Immigrants from Switzerland vs Immigrants from Costa Rica Divorced or Separated

COMPARE

Immigrants from Switzerland
Race
Ancestry
AfghanAfricanAlaska NativeAlaskan AthabascanAlbanianAleutAlsatianAmericanApacheArabArapahoArgentineanArmenianAssyrian/Chaldean/SyriacAustralianAustrianBahamianBangladeshiBarbadianBasqueBelgianBelizeanBermudanBhutaneseBlackfeetBolivianBrazilianBritishBritish West IndianBulgarianBurmeseCajunCambodianCanadianCape VerdeanCarpatho RusynCelticCentral AmericanCentral American IndianCherokeeCheyenneChickasawChileanChineseChippewaChoctawColombianColvilleComancheCosta RicanCreeCreekCroatianCrowCubanCypriotCzechCzechoslovakianDanishDelawareDominicanDutchDutch West IndianEastern EuropeanEcuadorianEgyptianEnglishEstonianEthiopianEuropeanFijianFilipinoFinnishFrenchFrench American IndianFrench CanadianGermanGerman RussianGhanaianGreekGuamanian/ChamorroGuatemalanGuyaneseHaitianHmongHonduranHopiHoumaHungarianIcelanderIndian (Asian)IndonesianInupiatIranianIraqiIrishIroquoisIsraeliItalianJamaicanJapaneseJordanianKenyanKiowaKoreanLaotianLatvianLebaneseLiberianLithuanianLumbeeLuxembourgerMacedonianMalaysianMalteseMarshalleseMenomineeMexicanMexican American IndianMongolianMoroccanNative HawaiianNavajoNepaleseNew ZealanderNicaraguanNigerianNorthern EuropeanNorwegianOkinawanOsageOttawaPaiutePakistaniPalestinianPanamanianParaguayanPennsylvania GermanPeruvianPimaPolishPortuguesePotawatomiPuebloPuerto RicanPuget Sound SalishRomanianRussianSalvadoranSamoanScandinavianScotch-IrishScottishSeminoleSenegaleseSerbianShoshoneSierra LeoneanSiouxSlavicSlovakSloveneSomaliSouth AfricanSouth AmericanSouth American IndianSoviet UnionSpaniardSpanishSpanish AmericanSpanish American IndianSri LankanSubsaharan AfricanSudaneseSwedishSwissSyrianTaiwaneseThaiTlingit-HaidaTohono O'OdhamTonganTrinidadian and TobagonianTsimshianTurkishU.S. Virgin IslanderUgandanUkrainianUruguayanUteVenezuelanVietnameseWelshWest IndianYakamaYaquiYugoslavianYumanYup'ikZimbabwean
Immigration
NonimmigrantsImmigrantsAfghanistanAfricaAlbaniaArgentinaArmeniaAsiaAustraliaAustriaBahamasBangladeshBarbadosBelarusBelgiumBelizeBoliviaBosnia and HerzegovinaBrazilBulgariaBurma/MyanmarCabo VerdeCambodiaCameroonCanadaCaribbeanCentral AmericaChileChinaColombiaCongoCroatiaCubaCzechoslovakiaDenmarkDominicaDominican RepublicEastern AfricaEastern AsiaEastern EuropeEcuadorEgyptEl SalvadorEnglandEritreaEthiopiaEuropeFijiFranceGermanyGhanaGreeceGrenadaGuatemalaGuyanaHaitiHondurasHong KongHungaryIndiaIndonesiaIranIraqIrelandIsraelItalyJamaicaJapanJordanKazakhstanKenyaKoreaKuwaitLaosLatin AmericaLatviaLebanonLiberiaLithuaniaMalaysiaMexicoMicronesiaMiddle AfricaMoldovaMoroccoNepalNetherlandsNicaraguaNigeriaNorth AmericaNorth MacedoniaNorthern AfricaNorthern EuropeNorwayOceaniaPakistanPanamaPeruPhilippinesPolandPortugalRomaniaRussiaSaudi ArabiaScotlandSenegalSerbiaSierra LeoneSingaporeSomaliaSouth AfricaSouth AmericaSouth Central AsiaSouth Eastern AsiaSouthern EuropeSpainSri LankaSt. Vincent and the GrenadinesSudanSwedenSwitzerlandSyriaTaiwanThailandTrinidad and TobagoTurkeyUgandaUkraineUruguayUzbekistanVenezuelaVietnamWest IndiesWestern AfricaWestern AsiaWestern EuropeYemenZaireZimbabweAzores
Immigrants from Costa Rica
Race
Ancestry
AfghanAfricanAlaska NativeAlaskan AthabascanAlbanianAleutAlsatianAmericanApacheArabArapahoArgentineanArmenianAssyrian/Chaldean/SyriacAustralianAustrianBahamianBangladeshiBarbadianBasqueBelgianBelizeanBermudanBhutaneseBlackfeetBolivianBrazilianBritishBritish West IndianBulgarianBurmeseCajunCambodianCanadianCape VerdeanCarpatho RusynCelticCentral AmericanCentral American IndianCherokeeCheyenneChickasawChileanChineseChippewaChoctawColombianColvilleComancheCosta RicanCreeCreekCroatianCrowCubanCypriotCzechCzechoslovakianDanishDelawareDominicanDutchDutch West IndianEastern EuropeanEcuadorianEgyptianEnglishEstonianEthiopianEuropeanFijianFilipinoFinnishFrenchFrench American IndianFrench CanadianGermanGerman RussianGhanaianGreekGuamanian/ChamorroGuatemalanGuyaneseHaitianHmongHonduranHopiHoumaHungarianIcelanderIndian (Asian)IndonesianInupiatIranianIraqiIrishIroquoisIsraeliItalianJamaicanJapaneseJordanianKenyanKiowaKoreanLaotianLatvianLebaneseLiberianLithuanianLumbeeLuxembourgerMacedonianMalaysianMalteseMarshalleseMenomineeMexicanMexican American IndianMongolianMoroccanNative HawaiianNavajoNepaleseNew ZealanderNicaraguanNigerianNorthern EuropeanNorwegianOkinawanOsageOttawaPaiutePakistaniPalestinianPanamanianParaguayanPennsylvania GermanPeruvianPimaPolishPortuguesePotawatomiPuebloPuerto RicanPuget Sound SalishRomanianRussianSalvadoranSamoanScandinavianScotch-IrishScottishSeminoleSenegaleseSerbianShoshoneSierra LeoneanSiouxSlavicSlovakSloveneSomaliSouth AfricanSouth AmericanSouth American IndianSoviet UnionSpaniardSpanishSpanish AmericanSpanish American IndianSri LankanSubsaharan AfricanSudaneseSwedishSwissSyrianTaiwaneseThaiTlingit-HaidaTohono O'OdhamTonganTrinidadian and TobagonianTsimshianTurkishU.S. Virgin IslanderUgandanUkrainianUruguayanUteVenezuelanVietnameseWelshWest IndianYakamaYaquiYugoslavianYumanYup'ikZimbabwean
Immigration
NonimmigrantsImmigrantsAfghanistanAfricaAlbaniaArgentinaArmeniaAsiaAustraliaAustriaBahamasBangladeshBarbadosBelarusBelgiumBelizeBoliviaBosnia and HerzegovinaBrazilBulgariaBurma/MyanmarCabo VerdeCambodiaCameroonCanadaCaribbeanCentral AmericaChileChinaColombiaCongoCosta RicaCroatiaCubaCzechoslovakiaDenmarkDominicaDominican RepublicEastern AfricaEastern AsiaEastern EuropeEcuadorEgyptEl SalvadorEnglandEritreaEthiopiaEuropeFijiFranceGermanyGhanaGreeceGrenadaGuatemalaGuyanaHaitiHondurasHong KongHungaryIndiaIndonesiaIranIraqIrelandIsraelItalyJamaicaJapanJordanKazakhstanKenyaKoreaKuwaitLaosLatin AmericaLatviaLebanonLiberiaLithuaniaMalaysiaMexicoMicronesiaMiddle AfricaMoldovaMoroccoNepalNetherlandsNicaraguaNigeriaNorth AmericaNorth MacedoniaNorthern AfricaNorthern EuropeNorwayOceaniaPakistanPanamaPeruPhilippinesPolandPortugalRomaniaRussiaSaudi ArabiaScotlandSenegalSerbiaSierra LeoneSingaporeSomaliaSouth AfricaSouth AmericaSouth Central AsiaSouth Eastern AsiaSouthern EuropeSpainSri LankaSt. Vincent and the GrenadinesSudanSwedenSyriaTaiwanThailandTrinidad and TobagoTurkeyUgandaUkraineUruguayUzbekistanVenezuelaVietnamWest IndiesWestern AfricaWestern AsiaWestern EuropeYemenZaireZimbabweAzores
Divorced or Separated
Income
Poverty
Unemployment
Labor Participation
Family Structure
Vehicle Availability
Education Level
Disability

Divorced or Separated Comparison

Immigrants from Switzerland

Immigrants from Costa Rica

Exceptional
Fair
11.5%
DIVORCED OR SEPARATED
99.4/ 100
METRIC RATING
80th/ 347
METRIC RANK
12.2%
DIVORCED OR SEPARATED
21.3/ 100
METRIC RATING
205th/ 347
METRIC RANK

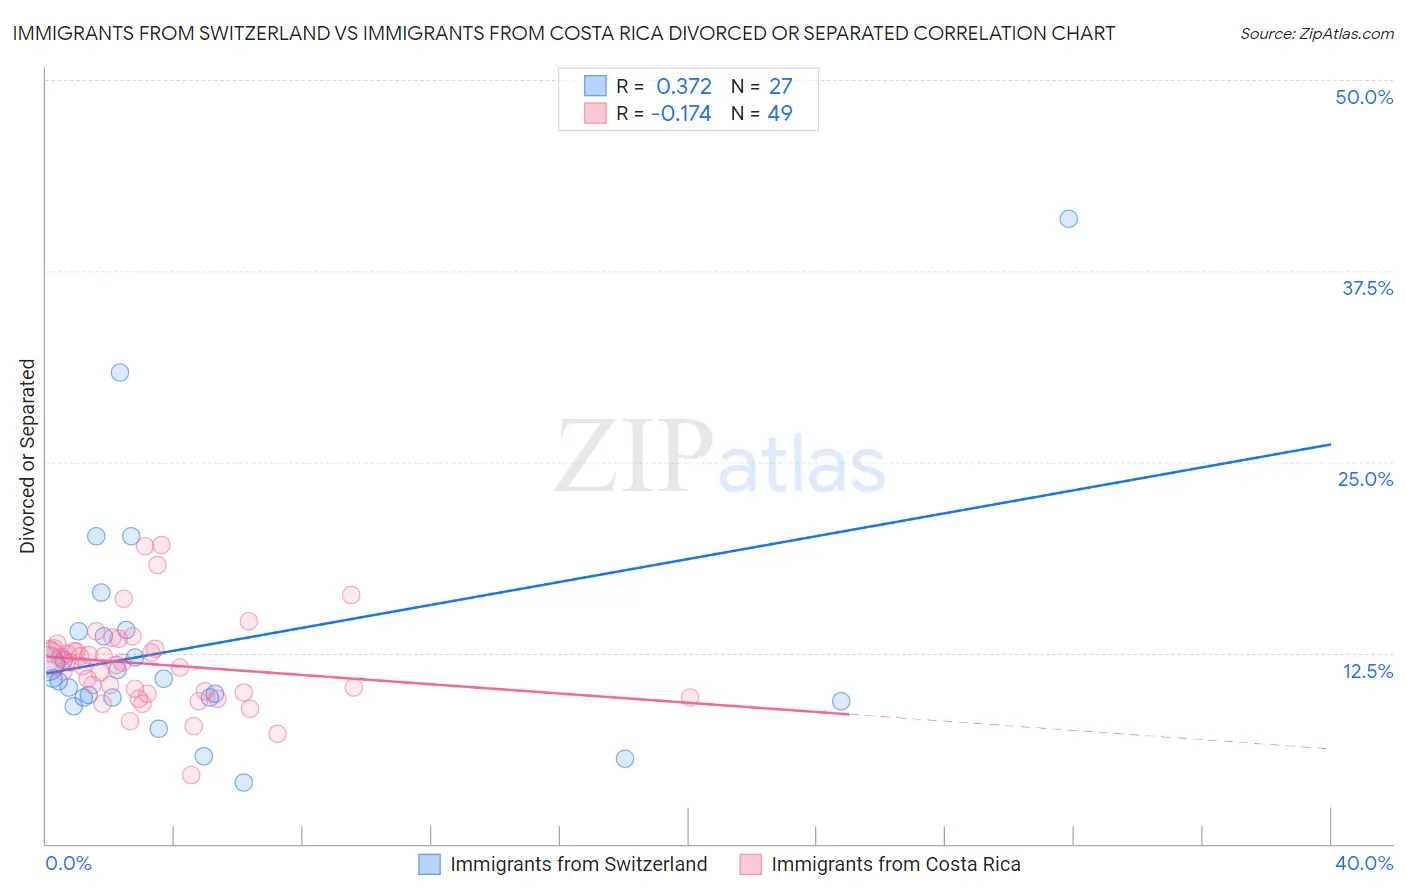
Immigrants from Switzerland vs Immigrants from Costa Rica Divorced or Separated Correlation Chart

The statistical analysis conducted on geographies consisting of 148,058,792 people shows a mild positive correlation between the proportion of Immigrants from Switzerland and percentage of population currently divorced or separated in the United States with a correlation coefficient (R) of 0.372 and weighted average of 11.5%. Similarly, the statistical analysis conducted on geographies consisting of 204,241,125 people shows a poor negative correlation between the proportion of Immigrants from Costa Rica and percentage of population currently divorced or separated in the United States with a correlation coefficient (R) of -0.174 and weighted average of 12.2%, a difference of 5.8%.
Immigrants from Switzerland vs Immigrants from Costa Rica Divorced or Separated

Divorced or Separated Correlation Summary

MeasurementImmigrants from SwitzerlandImmigrants from Costa Rica
Minimum4.0%4.5%
Maximum40.9%19.6%
Range36.9%15.0%
Mean12.9%11.8%
Median10.8%11.8%
Interquartile 25% (IQ1)9.6%9.9%
Interquartile 75% (IQ3)13.9%12.8%
Interquartile Range (IQR)4.3%2.9%
Standard Deviation (Sample)7.7%2.9%
Standard Deviation (Population)7.6%2.9%

Similar Demographics by Divorced or Separated

Demographics Similar to Immigrants from Switzerland by Divorced or Separated

In terms of divorced or separated, the demographic groups most similar to Immigrants from Switzerland are Russian (11.5%, a difference of 0.010%), Guyanese (11.5%, a difference of 0.020%), Afghan (11.5%, a difference of 0.060%), Immigrants from Romania (11.5%, a difference of 0.090%), and Immigrants from Bulgaria (11.5%, a difference of 0.12%).
DemographicsRating | RankDivorced or Separated
Immigrants | North Macedonia
99.6
/100
|
#73
Exceptional
11.5%
Taiwanese
99.6
/100
|
#74
Exceptional
11.5%
Immigrants | Northern Africa
99.6
/100
|
#75
Exceptional
11.5%
Albanians
99.6
/100
|
#76
Exceptional
11.5%
Immigrants | Italy
99.5
/100
|
#77
Exceptional
11.5%
Afghans
99.4
/100
|
#78
Exceptional
11.5%
Guyanese
99.4
/100
|
#79
Exceptional
11.5%
Immigrants | Switzerland
99.4
/100
|
#80
Exceptional
11.5%
Russians
99.4
/100
|
#81
Exceptional
11.5%
Immigrants | Romania
99.3
/100
|
#82
Exceptional
11.5%
Immigrants | Bulgaria
99.3
/100
|
#83
Exceptional
11.5%
Bulgarians
99.3
/100
|
#84
Exceptional
11.5%
Immigrants | Albania
99.3
/100
|
#85
Exceptional
11.5%
Immigrants | Latvia
99.2
/100
|
#86
Exceptional
11.6%
Immigrants | Nepal
99.2
/100
|
#87
Exceptional
11.6%

Demographics Similar to Immigrants from Costa Rica by Divorced or Separated

In terms of divorced or separated, the demographic groups most similar to Immigrants from Costa Rica are Slovak (12.2%, a difference of 0.010%), Mexican (12.2%, a difference of 0.010%), Kenyan (12.2%, a difference of 0.030%), Immigrants from Guatemala (12.2%, a difference of 0.10%), and Portuguese (12.2%, a difference of 0.11%).
DemographicsRating | RankDivorced or Separated
Nigerians
30.1
/100
|
#198
Fair
12.1%
Central Americans
29.4
/100
|
#199
Fair
12.1%
South Americans
28.6
/100
|
#200
Fair
12.2%
Guatemalans
26.9
/100
|
#201
Fair
12.2%
Portuguese
23.5
/100
|
#202
Fair
12.2%
Immigrants | Guatemala
23.2
/100
|
#203
Fair
12.2%
Kenyans
21.8
/100
|
#204
Fair
12.2%
Immigrants | Costa Rica
21.3
/100
|
#205
Fair
12.2%
Slovaks
21.0
/100
|
#206
Fair
12.2%
Mexicans
21.0
/100
|
#207
Fair
12.2%
Immigrants | Ghana
18.8
/100
|
#208
Poor
12.2%
Immigrants | Trinidad and Tobago
17.8
/100
|
#209
Poor
12.2%
Slavs
17.0
/100
|
#210
Poor
12.2%
Trinidadians and Tobagonians
16.6
/100
|
#211
Poor
12.2%
Immigrants | Kenya
16.5
/100
|
#212
Poor
12.2%