Immigrants from Peru vs Immigrants from Armenia Family Households with Children
COMPARE
Immigrants from Peru
Immigrants from Armenia
Family Households with Children
Family Households with Children Comparison
Immigrants from Peru
Immigrants from Armenia
28.9%
FAMILY HOUSEHOLDS WITH CHILDREN
100.0/ 100
METRIC RATING
51st/ 347
METRIC RANK
25.6%
FAMILY HOUSEHOLDS WITH CHILDREN
0.0/ 100
METRIC RATING
340th/ 347
METRIC RANK
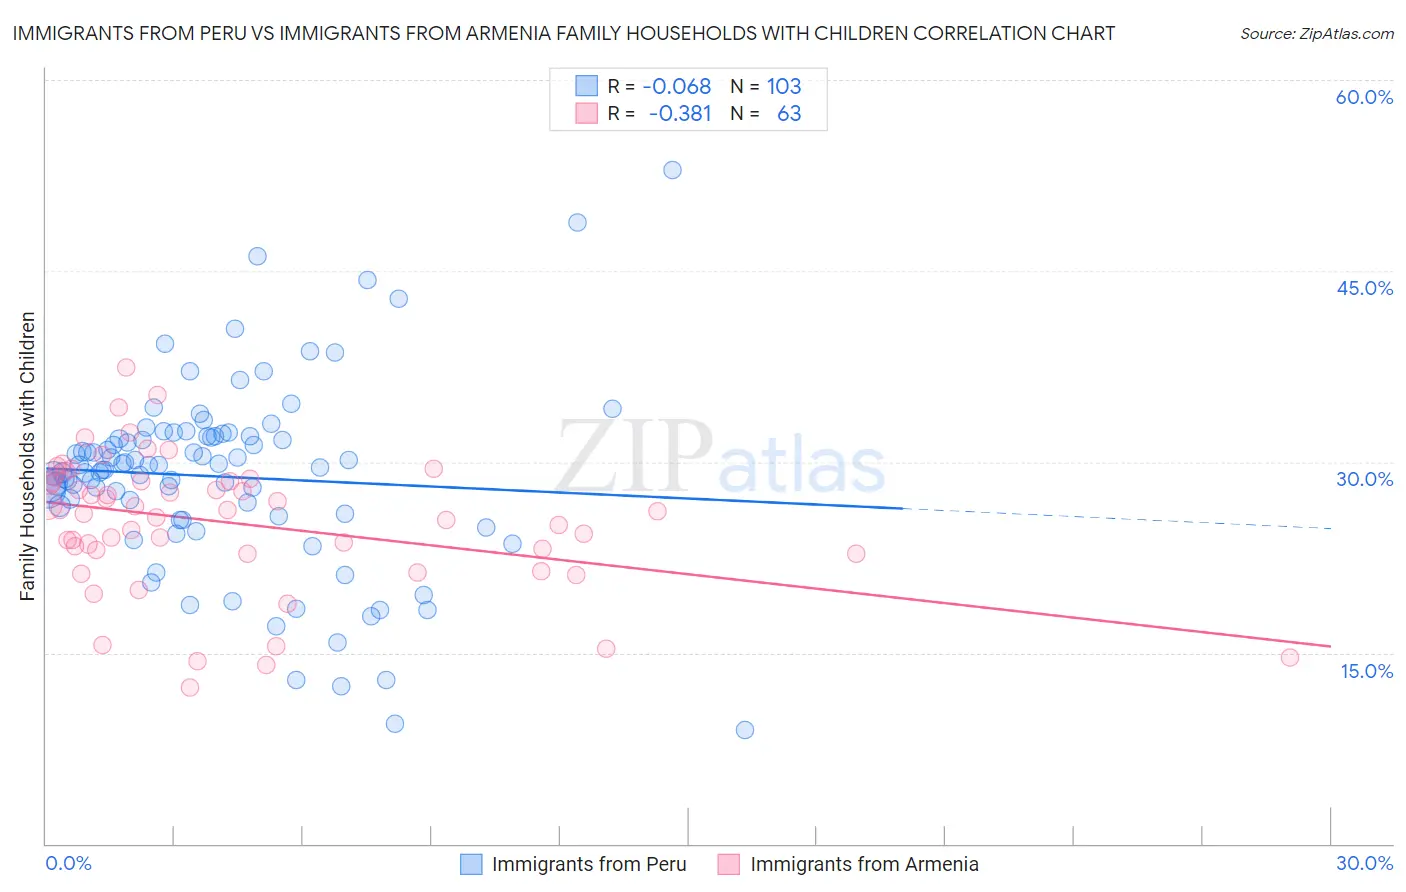
Immigrants from Peru vs Immigrants from Armenia Family Households with Children Correlation Chart
The statistical analysis conducted on geographies consisting of 328,640,714 people shows a slight negative correlation between the proportion of Immigrants from Peru and percentage of family households with children in the United States with a correlation coefficient (R) of -0.068 and weighted average of 28.9%. Similarly, the statistical analysis conducted on geographies consisting of 97,683,198 people shows a mild negative correlation between the proportion of Immigrants from Armenia and percentage of family households with children in the United States with a correlation coefficient (R) of -0.381 and weighted average of 25.6%, a difference of 13.2%.
Family Households with Children Correlation Summary
| Measurement | Immigrants from Peru | Immigrants from Armenia |
| Minimum | 9.0% | 12.3% |
| Maximum | 52.9% | 37.4% |
| Range | 44.0% | 25.2% |
| Mean | 28.8% | 25.2% |
| Median | 29.5% | 26.2% |
| Interquartile 25% (IQ1) | 25.8% | 22.8% |
| Interquartile 75% (IQ3) | 32.0% | 28.5% |
| Interquartile Range (IQR) | 6.2% | 5.7% |
| Standard Deviation (Sample) | 7.5% | 5.3% |
| Standard Deviation (Population) | 7.4% | 5.2% |
Similar Demographics by Family Households with Children
Demographics Similar to Immigrants from Peru by Family Households with Children
In terms of family households with children, the demographic groups most similar to Immigrants from Peru are Immigrants (28.9%, a difference of 0.040%), Guatemalan (28.9%, a difference of 0.080%), Jordanian (29.0%, a difference of 0.14%), Immigrants from Cambodia (28.9%, a difference of 0.15%), and Apache (29.0%, a difference of 0.23%).
| Demographics | Rating | Rank | Family Households with Children |
| Immigrants | Taiwan | 100.0 /100 | #44 | Exceptional 29.0% |
| Fijians | 100.0 /100 | #45 | Exceptional 29.0% |
| Immigrants | Philippines | 100.0 /100 | #46 | Exceptional 29.0% |
| Peruvians | 100.0 /100 | #47 | Exceptional 29.0% |
| Apache | 100.0 /100 | #48 | Exceptional 29.0% |
| Jordanians | 100.0 /100 | #49 | Exceptional 29.0% |
| Immigrants | Immigrants | 100.0 /100 | #50 | Exceptional 28.9% |
| Immigrants | Peru | 100.0 /100 | #51 | Exceptional 28.9% |
| Guatemalans | 100.0 /100 | #52 | Exceptional 28.9% |
| Immigrants | Cambodia | 100.0 /100 | #53 | Exceptional 28.9% |
| Sierra Leoneans | 100.0 /100 | #54 | Exceptional 28.9% |
| Immigrants | Asia | 100.0 /100 | #55 | Exceptional 28.8% |
| Immigrants | Guatemala | 100.0 /100 | #56 | Exceptional 28.8% |
| Danes | 100.0 /100 | #57 | Exceptional 28.7% |
| Hawaiians | 100.0 /100 | #58 | Exceptional 28.7% |
Demographics Similar to Immigrants from Armenia by Family Households with Children
In terms of family households with children, the demographic groups most similar to Immigrants from Armenia are Immigrants from St. Vincent and the Grenadines (25.6%, a difference of 0.040%), Arapaho (25.6%, a difference of 0.050%), Puerto Rican (25.6%, a difference of 0.080%), Immigrants from Serbia (25.5%, a difference of 0.38%), and Immigrants from West Indies (25.7%, a difference of 0.47%).
| Demographics | Rating | Rank | Family Households with Children |
| Immigrants | Switzerland | 0.0 /100 | #333 | Tragic 25.7% |
| Slovaks | 0.0 /100 | #334 | Tragic 25.7% |
| Immigrants | Croatia | 0.0 /100 | #335 | Tragic 25.7% |
| Immigrants | West Indies | 0.0 /100 | #336 | Tragic 25.7% |
| Puerto Ricans | 0.0 /100 | #337 | Tragic 25.6% |
| Arapaho | 0.0 /100 | #338 | Tragic 25.6% |
| Immigrants | St. Vincent and the Grenadines | 0.0 /100 | #339 | Tragic 25.6% |
| Immigrants | Armenia | 0.0 /100 | #340 | Tragic 25.6% |
| Immigrants | Serbia | 0.0 /100 | #341 | Tragic 25.5% |
| Alsatians | 0.0 /100 | #342 | Tragic 25.3% |
| Hopi | 0.0 /100 | #343 | Tragic 25.2% |
| Pueblo | 0.0 /100 | #344 | Tragic 25.2% |
| Immigrants | Grenada | 0.0 /100 | #345 | Tragic 25.2% |
| Carpatho Rusyns | 0.0 /100 | #346 | Tragic 25.2% |
| Soviet Union | 0.0 /100 | #347 | Tragic 24.8% |