Immigrants from Sri Lanka vs Icelander Unemployment Among Ages 65 to 74 years
COMPARE
Immigrants from Sri Lanka
Icelander
Unemployment Among Ages 65 to 74 years
Unemployment Among Ages 65 to 74 years Comparison
Immigrants from Sri Lanka
Icelanders
5.3%
UNEMPLOYMENT AMONG AGES 65 TO 74 YEARS
73.8/ 100
METRIC RATING
148th/ 347
METRIC RANK
5.4%
UNEMPLOYMENT AMONG AGES 65 TO 74 YEARS
14.2/ 100
METRIC RATING
205th/ 347
METRIC RANK
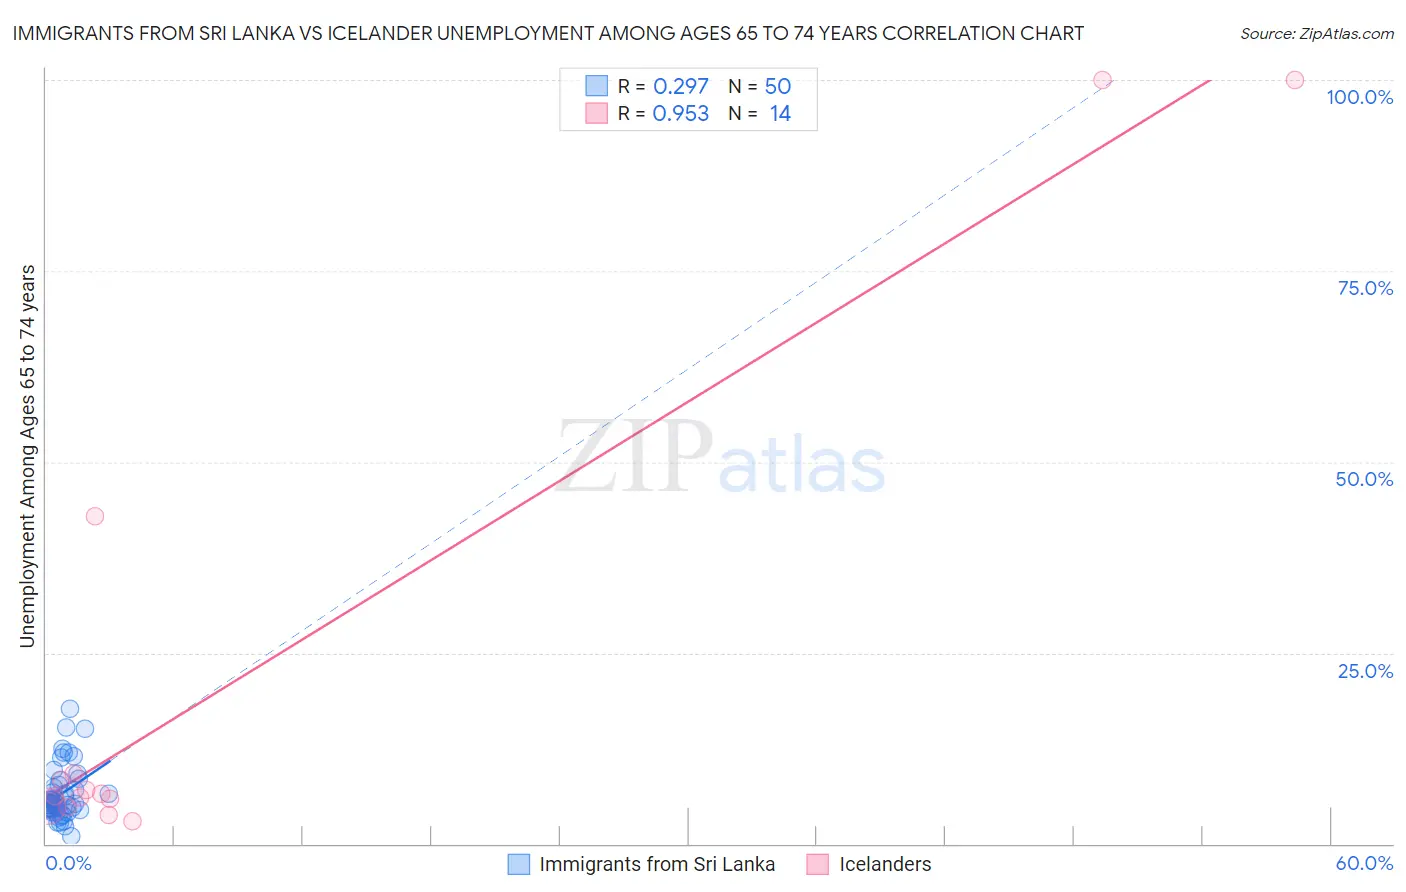
Immigrants from Sri Lanka vs Icelander Unemployment Among Ages 65 to 74 years Correlation Chart
The statistical analysis conducted on geographies consisting of 142,714,330 people shows a weak positive correlation between the proportion of Immigrants from Sri Lanka and unemployment rate among population between the ages 65 and 74 in the United States with a correlation coefficient (R) of 0.297 and weighted average of 5.3%. Similarly, the statistical analysis conducted on geographies consisting of 147,733,827 people shows a perfect positive correlation between the proportion of Icelanders and unemployment rate among population between the ages 65 and 74 in the United States with a correlation coefficient (R) of 0.953 and weighted average of 5.4%, a difference of 2.4%.
Unemployment Among Ages 65 to 74 years Correlation Summary
| Measurement | Immigrants from Sri Lanka | Icelander |
| Minimum | 1.0% | 2.9% |
| Maximum | 17.6% | 100.0% |
| Range | 16.6% | 97.1% |
| Mean | 6.6% | 22.0% |
| Median | 5.3% | 6.4% |
| Interquartile 25% (IQ1) | 4.6% | 4.9% |
| Interquartile 75% (IQ3) | 7.6% | 9.2% |
| Interquartile Range (IQR) | 3.1% | 4.3% |
| Standard Deviation (Sample) | 3.5% | 34.5% |
| Standard Deviation (Population) | 3.5% | 33.2% |
Similar Demographics by Unemployment Among Ages 65 to 74 years
Demographics Similar to Immigrants from Sri Lanka by Unemployment Among Ages 65 to 74 years
In terms of unemployment among ages 65 to 74 years, the demographic groups most similar to Immigrants from Sri Lanka are Immigrants from Romania (5.3%, a difference of 0.010%), Immigrants from Poland (5.3%, a difference of 0.020%), Irish (5.3%, a difference of 0.040%), Immigrants from Latvia (5.3%, a difference of 0.040%), and Immigrants from Indonesia (5.3%, a difference of 0.040%).
| Demographics | Rating | Rank | Unemployment Among Ages 65 to 74 years |
| Immigrants | Asia | 78.4 /100 | #141 | Good 5.3% |
| Turks | 76.2 /100 | #142 | Good 5.3% |
| New Zealanders | 76.1 /100 | #143 | Good 5.3% |
| Immigrants | Chile | 76.0 /100 | #144 | Good 5.3% |
| Canadians | 75.0 /100 | #145 | Good 5.3% |
| Irish | 74.8 /100 | #146 | Good 5.3% |
| Immigrants | Latvia | 74.6 /100 | #147 | Good 5.3% |
| Immigrants | Sri Lanka | 73.8 /100 | #148 | Good 5.3% |
| Immigrants | Romania | 73.5 /100 | #149 | Good 5.3% |
| Immigrants | Poland | 73.2 /100 | #150 | Good 5.3% |
| Immigrants | Indonesia | 72.9 /100 | #151 | Good 5.3% |
| Spanish | 72.6 /100 | #152 | Good 5.3% |
| Immigrants | Cabo Verde | 72.5 /100 | #153 | Good 5.3% |
| Poles | 72.4 /100 | #154 | Good 5.3% |
| Immigrants | Cameroon | 72.1 /100 | #155 | Good 5.3% |
Demographics Similar to Icelanders by Unemployment Among Ages 65 to 74 years
In terms of unemployment among ages 65 to 74 years, the demographic groups most similar to Icelanders are Subsaharan African (5.4%, a difference of 0.010%), Argentinean (5.4%, a difference of 0.010%), Seminole (5.4%, a difference of 0.010%), Immigrants from Western Asia (5.4%, a difference of 0.040%), and Immigrants from Pakistan (5.4%, a difference of 0.070%).
| Demographics | Rating | Rank | Unemployment Among Ages 65 to 74 years |
| Albanians | 17.8 /100 | #198 | Poor 5.4% |
| Immigrants | Belgium | 16.2 /100 | #199 | Poor 5.4% |
| Immigrants | Pakistan | 15.2 /100 | #200 | Poor 5.4% |
| Immigrants | Western Asia | 14.9 /100 | #201 | Poor 5.4% |
| Sub-Saharan Africans | 14.4 /100 | #202 | Poor 5.4% |
| Argentineans | 14.3 /100 | #203 | Poor 5.4% |
| Seminole | 14.3 /100 | #204 | Poor 5.4% |
| Icelanders | 14.2 /100 | #205 | Poor 5.4% |
| Africans | 12.8 /100 | #206 | Poor 5.5% |
| Immigrants | Uzbekistan | 12.5 /100 | #207 | Poor 5.5% |
| Dutch West Indians | 11.5 /100 | #208 | Poor 5.5% |
| Immigrants | Honduras | 10.4 /100 | #209 | Poor 5.5% |
| Immigrants | Northern Africa | 10.1 /100 | #210 | Poor 5.5% |
| Immigrants | Croatia | 9.1 /100 | #211 | Tragic 5.5% |
| Haitians | 7.7 /100 | #212 | Tragic 5.5% |