Immigrants from Southern Europe vs German Russian Unemployment Among Ages 25 to 29 years
COMPARE
Immigrants from Southern Europe
German Russian
Unemployment Among Ages 25 to 29 years
Unemployment Among Ages 25 to 29 years Comparison
Immigrants from Southern Europe
German Russians
6.8%
UNEMPLOYMENT AMONG AGES 25 TO 29 YEARS
24.6/ 100
METRIC RATING
198th/ 347
METRIC RANK
6.2%
UNEMPLOYMENT AMONG AGES 25 TO 29 YEARS
99.0/ 100
METRIC RATING
49th/ 347
METRIC RANK
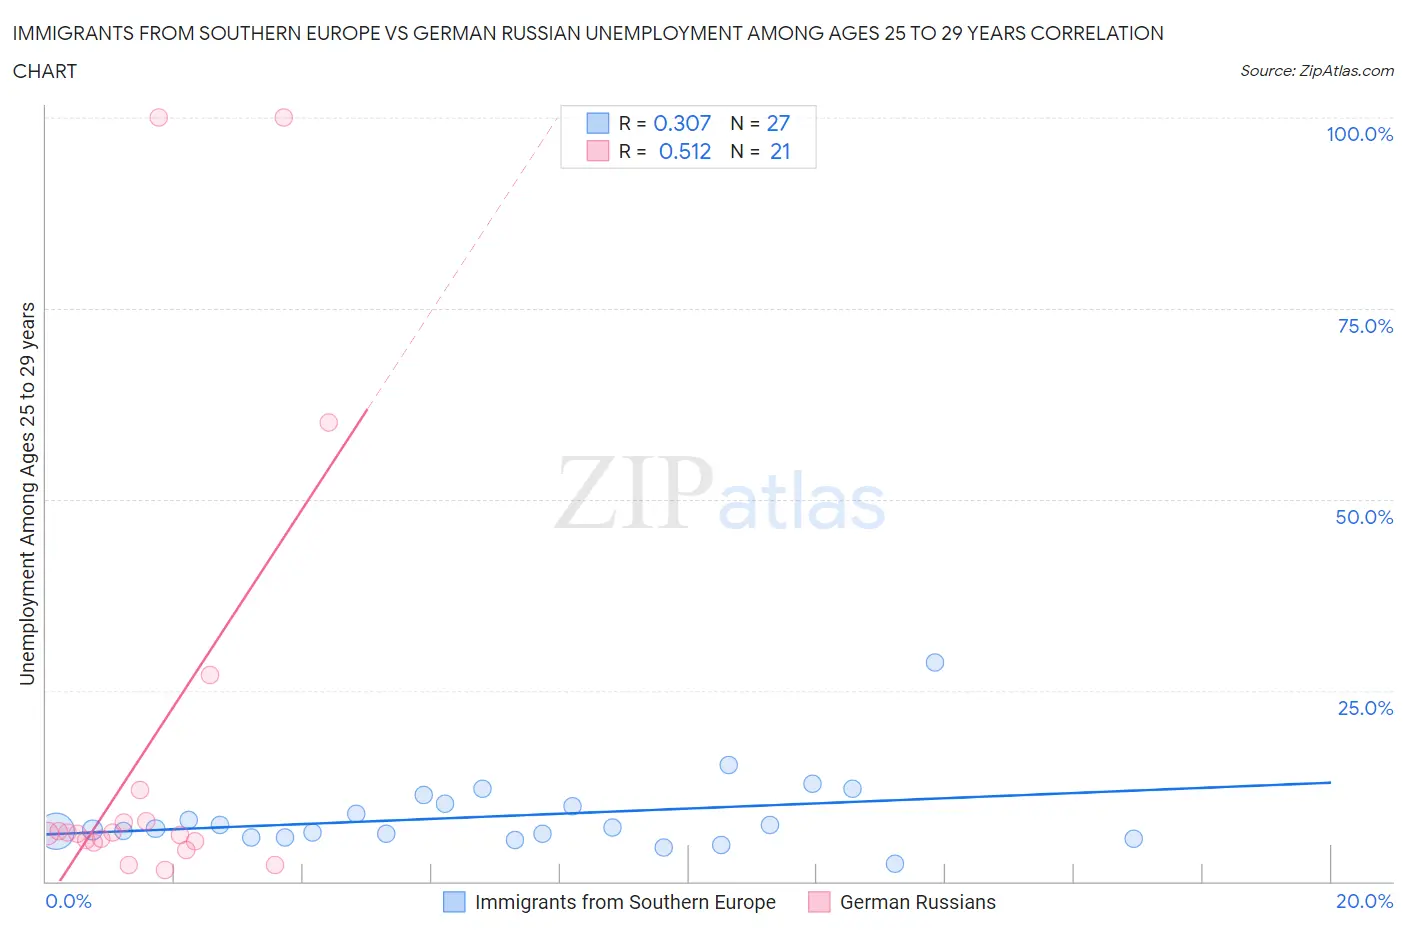
Immigrants from Southern Europe vs German Russian Unemployment Among Ages 25 to 29 years Correlation Chart
The statistical analysis conducted on geographies consisting of 381,533,960 people shows a mild positive correlation between the proportion of Immigrants from Southern Europe and unemployment rate among population between the ages 25 and 29 in the United States with a correlation coefficient (R) of 0.307 and weighted average of 6.8%. Similarly, the statistical analysis conducted on geographies consisting of 94,750,575 people shows a substantial positive correlation between the proportion of German Russians and unemployment rate among population between the ages 25 and 29 in the United States with a correlation coefficient (R) of 0.512 and weighted average of 6.2%, a difference of 9.4%.
Unemployment Among Ages 25 to 29 years Correlation Summary
| Measurement | Immigrants from Southern Europe | German Russian |
| Minimum | 2.3% | 1.4% |
| Maximum | 28.6% | 100.0% |
| Range | 26.3% | 98.6% |
| Mean | 8.5% | 18.3% |
| Median | 7.0% | 6.3% |
| Interquartile 25% (IQ1) | 5.8% | 5.2% |
| Interquartile 75% (IQ3) | 10.2% | 10.0% |
| Interquartile Range (IQR) | 4.4% | 4.8% |
| Standard Deviation (Sample) | 5.0% | 30.0% |
| Standard Deviation (Population) | 4.9% | 29.2% |
Similar Demographics by Unemployment Among Ages 25 to 29 years
Demographics Similar to Immigrants from Southern Europe by Unemployment Among Ages 25 to 29 years
In terms of unemployment among ages 25 to 29 years, the demographic groups most similar to Immigrants from Southern Europe are Guamanian/Chamorro (6.8%, a difference of 0.020%), South American Indian (6.8%, a difference of 0.10%), Italian (6.8%, a difference of 0.16%), Basque (6.8%, a difference of 0.17%), and Hungarian (6.8%, a difference of 0.18%).
| Demographics | Rating | Rank | Unemployment Among Ages 25 to 29 years |
| Chickasaw | 28.7 /100 | #191 | Fair 6.7% |
| Immigrants | Ukraine | 28.6 /100 | #192 | Fair 6.7% |
| Alsatians | 28.1 /100 | #193 | Fair 6.7% |
| Immigrants | Greece | 28.0 /100 | #194 | Fair 6.7% |
| Immigrants | Western Asia | 27.3 /100 | #195 | Fair 6.7% |
| Hungarians | 26.8 /100 | #196 | Fair 6.8% |
| Italians | 26.5 /100 | #197 | Fair 6.8% |
| Immigrants | Southern Europe | 24.6 /100 | #198 | Fair 6.8% |
| Guamanians/Chamorros | 24.3 /100 | #199 | Fair 6.8% |
| South American Indians | 23.3 /100 | #200 | Fair 6.8% |
| Basques | 22.5 /100 | #201 | Fair 6.8% |
| Immigrants | Argentina | 21.6 /100 | #202 | Fair 6.8% |
| Immigrants | Norway | 21.2 /100 | #203 | Fair 6.8% |
| Scotch-Irish | 20.0 /100 | #204 | Poor 6.8% |
| Immigrants | England | 19.8 /100 | #205 | Poor 6.8% |
Demographics Similar to German Russians by Unemployment Among Ages 25 to 29 years
In terms of unemployment among ages 25 to 29 years, the demographic groups most similar to German Russians are Soviet Union (6.2%, a difference of 0.060%), Immigrants from Australia (6.2%, a difference of 0.070%), Latvian (6.2%, a difference of 0.080%), Burmese (6.2%, a difference of 0.090%), and Immigrants from Lithuania (6.2%, a difference of 0.10%).
| Demographics | Rating | Rank | Unemployment Among Ages 25 to 29 years |
| Jordanians | 99.3 /100 | #42 | Exceptional 6.1% |
| Czechs | 99.2 /100 | #43 | Exceptional 6.2% |
| Mongolians | 99.2 /100 | #44 | Exceptional 6.2% |
| Venezuelans | 99.1 /100 | #45 | Exceptional 6.2% |
| Immigrants | Lithuania | 99.0 /100 | #46 | Exceptional 6.2% |
| Latvians | 99.0 /100 | #47 | Exceptional 6.2% |
| Immigrants | Australia | 99.0 /100 | #48 | Exceptional 6.2% |
| German Russians | 99.0 /100 | #49 | Exceptional 6.2% |
| Soviet Union | 98.9 /100 | #50 | Exceptional 6.2% |
| Burmese | 98.9 /100 | #51 | Exceptional 6.2% |
| Immigrants | Turkey | 98.9 /100 | #52 | Exceptional 6.2% |
| Turks | 98.8 /100 | #53 | Exceptional 6.2% |
| Swedes | 98.8 /100 | #54 | Exceptional 6.2% |
| Immigrants | Netherlands | 98.7 /100 | #55 | Exceptional 6.2% |
| Immigrants | Burma/Myanmar | 98.7 /100 | #56 | Exceptional 6.2% |