Immigrants from South Eastern Asia vs Polish Vision Disability

COMPARE

Immigrants from South Eastern Asia
Race
Ancestry
AfghanAfricanAlaska NativeAlaskan AthabascanAlbanianAleutAlsatianAmericanApacheArabArapahoArgentineanArmenianAssyrian/Chaldean/SyriacAustralianAustrianBahamianBangladeshiBarbadianBasqueBelgianBelizeanBermudanBhutaneseBlackfeetBolivianBrazilianBritishBritish West IndianBulgarianBurmeseCajunCambodianCanadianCape VerdeanCarpatho RusynCelticCentral AmericanCentral American IndianCherokeeCheyenneChickasawChileanChineseChippewaChoctawColombianColvilleComancheCosta RicanCreeCreekCroatianCrowCubanCypriotCzechCzechoslovakianDanishDelawareDominicanDutchDutch West IndianEastern EuropeanEcuadorianEgyptianEnglishEstonianEthiopianEuropeanFijianFilipinoFinnishFrenchFrench American IndianFrench CanadianGermanGerman RussianGhanaianGreekGuamanian/ChamorroGuatemalanGuyaneseHaitianHmongHonduranHopiHoumaHungarianIcelanderIndian (Asian)IndonesianInupiatIranianIraqiIrishIroquoisIsraeliItalianJamaicanJapaneseJordanianKenyanKiowaKoreanLaotianLatvianLebaneseLiberianLithuanianLumbeeLuxembourgerMacedonianMalaysianMalteseMarshalleseMenomineeMexicanMexican American IndianMongolianMoroccanNative HawaiianNavajoNepaleseNew ZealanderNicaraguanNigerianNorthern EuropeanNorwegianOkinawanOsageOttawaPaiutePakistaniPalestinianPanamanianParaguayanPennsylvania GermanPeruvianPimaPortuguesePotawatomiPuebloPuerto RicanPuget Sound SalishRomanianRussianSalvadoranSamoanScandinavianScotch-IrishScottishSeminoleSenegaleseSerbianShoshoneSierra LeoneanSiouxSlavicSlovakSloveneSomaliSouth AfricanSouth AmericanSouth American IndianSoviet UnionSpaniardSpanishSpanish AmericanSpanish American IndianSri LankanSubsaharan AfricanSudaneseSwedishSwissSyrianTaiwaneseThaiTlingit-HaidaTohono O'OdhamTonganTrinidadian and TobagonianTsimshianTurkishU.S. Virgin IslanderUgandanUkrainianUruguayanUteVenezuelanVietnameseWelshWest IndianYakamaYaquiYugoslavianYumanYup'ikZimbabwean
Immigration
NonimmigrantsImmigrantsAfghanistanAfricaAlbaniaArgentinaArmeniaAsiaAustraliaAustriaBahamasBangladeshBarbadosBelarusBelgiumBelizeBoliviaBosnia and HerzegovinaBrazilBulgariaBurma/MyanmarCabo VerdeCambodiaCameroonCanadaCaribbeanCentral AmericaChileChinaColombiaCongoCosta RicaCroatiaCubaCzechoslovakiaDenmarkDominicaDominican RepublicEastern AfricaEastern AsiaEastern EuropeEcuadorEgyptEl SalvadorEnglandEritreaEthiopiaEuropeFijiFranceGermanyGhanaGreeceGrenadaGuatemalaGuyanaHaitiHondurasHong KongHungaryIndiaIndonesiaIranIraqIrelandIsraelItalyJamaicaJapanJordanKazakhstanKenyaKoreaKuwaitLaosLatin AmericaLatviaLebanonLiberiaLithuaniaMalaysiaMexicoMicronesiaMiddle AfricaMoldovaMoroccoNepalNetherlandsNicaraguaNigeriaNorth AmericaNorth MacedoniaNorthern AfricaNorthern EuropeNorwayOceaniaPakistanPanamaPeruPhilippinesPolandPortugalRomaniaRussiaSaudi ArabiaScotlandSenegalSerbiaSierra LeoneSingaporeSomaliaSouth AfricaSouth AmericaSouth Central AsiaSouth Eastern AsiaSouthern EuropeSpainSri LankaSt. Vincent and the GrenadinesSudanSwedenSwitzerlandSyriaTaiwanThailandTrinidad and TobagoTurkeyUgandaUkraineUruguayUzbekistanVenezuelaVietnamWest IndiesWestern AfricaWestern AsiaWestern EuropeYemenZaireZimbabweAzores
Polish
Race
Ancestry
AfghanAfricanAlaska NativeAlaskan AthabascanAlbanianAleutAlsatianAmericanApacheArabArapahoArgentineanArmenianAssyrian/Chaldean/SyriacAustralianAustrianBahamianBangladeshiBarbadianBasqueBelgianBelizeanBermudanBhutaneseBlackfeetBolivianBrazilianBritishBritish West IndianBulgarianBurmeseCajunCambodianCanadianCape VerdeanCarpatho RusynCelticCentral AmericanCentral American IndianCherokeeCheyenneChickasawChileanChineseChippewaChoctawColombianColvilleComancheCosta RicanCreeCreekCroatianCrowCubanCypriotCzechCzechoslovakianDanishDelawareDominicanDutchDutch West IndianEastern EuropeanEcuadorianEgyptianEnglishEstonianEthiopianEuropeanFijianFilipinoFinnishFrenchFrench American IndianFrench CanadianGermanGerman RussianGhanaianGreekGuamanian/ChamorroGuatemalanGuyaneseHaitianHmongHonduranHopiHoumaHungarianIcelanderIndian (Asian)IndonesianInupiatIranianIraqiIrishIroquoisIsraeliItalianJamaicanJapaneseJordanianKenyanKiowaKoreanLaotianLatvianLebaneseLiberianLithuanianLumbeeLuxembourgerMacedonianMalaysianMalteseMarshalleseMenomineeMexicanMexican American IndianMongolianMoroccanNative HawaiianNavajoNepaleseNew ZealanderNicaraguanNigerianNorthern EuropeanNorwegianOkinawanOsageOttawaPaiutePakistaniPalestinianPanamanianParaguayanPennsylvania GermanPeruvianPimaPolishPortuguesePotawatomiPuebloPuerto RicanPuget Sound SalishRomanianRussianSalvadoranSamoanScandinavianScotch-IrishScottishSeminoleSenegaleseSerbianShoshoneSierra LeoneanSiouxSlavicSlovakSloveneSomaliSouth AfricanSouth AmericanSouth American IndianSoviet UnionSpaniardSpanishSpanish AmericanSpanish American IndianSri LankanSubsaharan AfricanSudaneseSwedishSwissSyrianTaiwaneseThaiTlingit-HaidaTohono O'OdhamTonganTrinidadian and TobagonianTsimshianTurkishU.S. Virgin IslanderUgandanUkrainianUruguayanUteVenezuelanVietnameseWelshWest IndianYakamaYaquiYugoslavianYumanYup'ikZimbabwean
Immigration
NonimmigrantsImmigrantsAfghanistanAfricaAlbaniaArgentinaArmeniaAsiaAustraliaAustriaBahamasBangladeshBarbadosBelarusBelgiumBelizeBoliviaBosnia and HerzegovinaBrazilBulgariaBurma/MyanmarCabo VerdeCambodiaCameroonCanadaCaribbeanCentral AmericaChileChinaColombiaCongoCosta RicaCroatiaCubaCzechoslovakiaDenmarkDominicaDominican RepublicEastern AfricaEastern AsiaEastern EuropeEcuadorEgyptEl SalvadorEnglandEritreaEthiopiaEuropeFijiFranceGermanyGhanaGreeceGrenadaGuatemalaGuyanaHaitiHondurasHong KongHungaryIndiaIndonesiaIranIraqIrelandIsraelItalyJamaicaJapanJordanKazakhstanKenyaKoreaKuwaitLaosLatin AmericaLatviaLebanonLiberiaLithuaniaMalaysiaMexicoMicronesiaMiddle AfricaMoldovaMoroccoNepalNetherlandsNicaraguaNigeriaNorth AmericaNorth MacedoniaNorthern AfricaNorthern EuropeNorwayOceaniaPakistanPanamaPeruPhilippinesPolandPortugalRomaniaRussiaSaudi ArabiaScotlandSenegalSerbiaSierra LeoneSingaporeSomaliaSouth AfricaSouth AmericaSouth Central AsiaSouthern EuropeSpainSri LankaSt. Vincent and the GrenadinesSudanSwedenSwitzerlandSyriaTaiwanThailandTrinidad and TobagoTurkeyUgandaUkraineUruguayUzbekistanVenezuelaVietnamWest IndiesWestern AfricaWestern AsiaWestern EuropeYemenZaireZimbabweAzores
Vision Disability
Income
Poverty
Unemployment
Labor Participation
Family Structure
Vehicle Availability
Education Level
Disability

Vision Disability Comparison

Immigrants from South Eastern Asia

Poles

Excellent
Exceptional
2.1%
VISION DISABILITY
86.3/ 100
METRIC RATING
137th/ 347
METRIC RANK
2.1%
VISION DISABILITY
92.0/ 100
METRIC RATING
117th/ 347
METRIC RANK

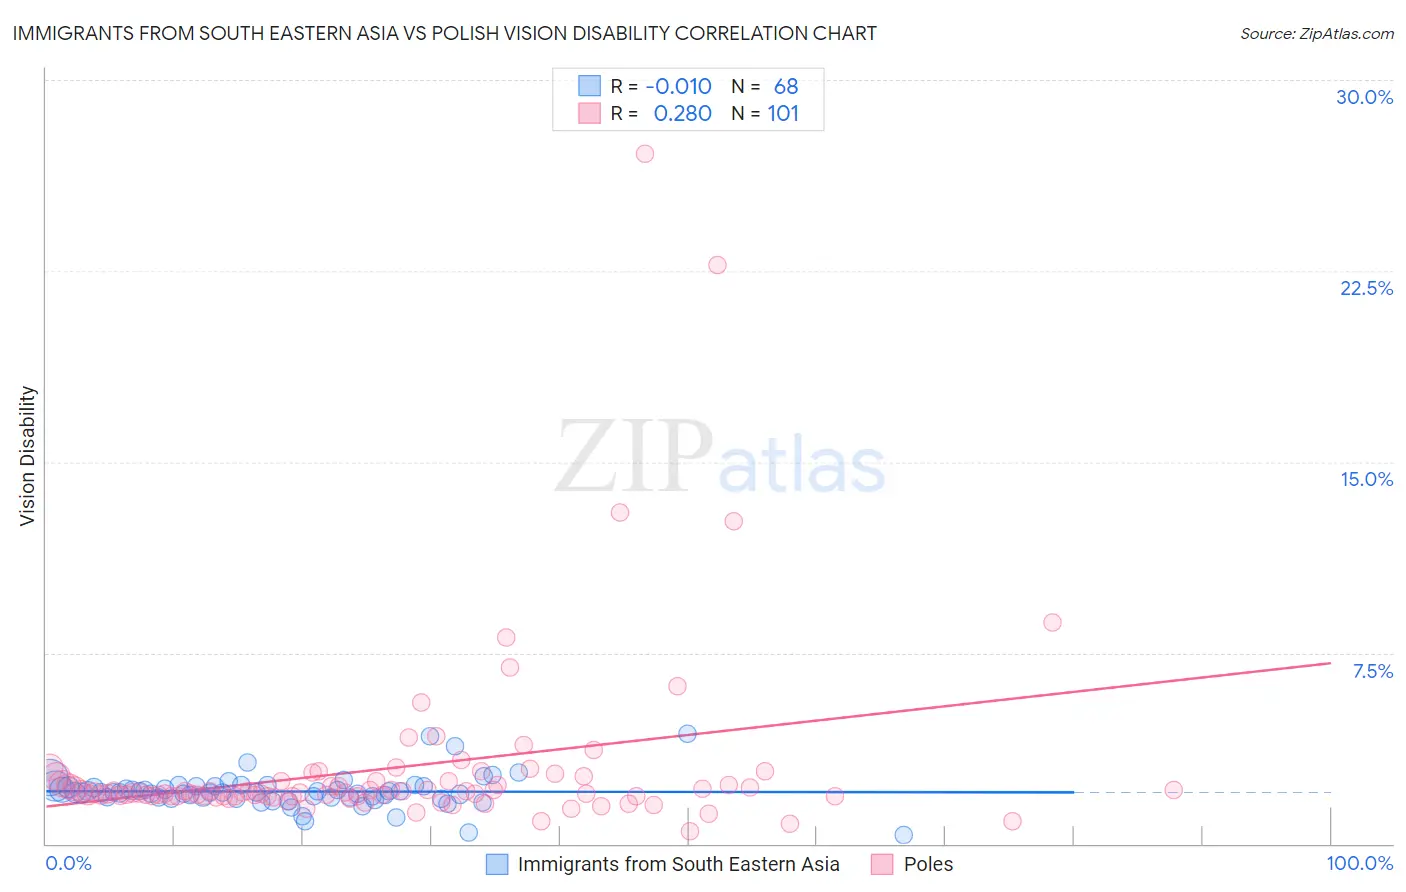
Immigrants from South Eastern Asia vs Polish Vision Disability Correlation Chart

The statistical analysis conducted on geographies consisting of 511,864,727 people shows no correlation between the proportion of Immigrants from South Eastern Asia and percentage of population with vision disability in the United States with a correlation coefficient (R) of -0.010 and weighted average of 2.1%. Similarly, the statistical analysis conducted on geographies consisting of 558,655,799 people shows a weak positive correlation between the proportion of Poles and percentage of population with vision disability in the United States with a correlation coefficient (R) of 0.280 and weighted average of 2.1%, a difference of 0.98%.
Immigrants from South Eastern Asia vs Polish Vision Disability

Vision Disability Correlation Summary

MeasurementImmigrants from South Eastern AsiaPolish
Minimum0.33%0.47%
Maximum4.3%27.1%
Range4.0%26.7%
Mean2.1%3.0%
Median2.0%2.0%
Interquartile 25% (IQ1)1.8%1.9%
Interquartile 75% (IQ3)2.2%2.5%
Interquartile Range (IQR)0.44%0.60%
Standard Deviation (Sample)0.65%3.7%
Standard Deviation (Population)0.64%3.7%

Demographics Similar to Immigrants from South Eastern Asia and Poles by Vision Disability

In terms of vision disability, the demographic groups most similar to Immigrants from South Eastern Asia are Czech (2.1%, a difference of 0.0%), Vietnamese (2.1%, a difference of 0.050%), Venezuelan (2.1%, a difference of 0.12%), Syrian (2.1%, a difference of 0.17%), and New Zealander (2.1%, a difference of 0.27%). Similarly, the demographic groups most similar to Poles are Immigrants from Philippines (2.1%, a difference of 0.13%), Immigrants from Uganda (2.1%, a difference of 0.14%), Immigrants from Zimbabwe (2.1%, a difference of 0.20%), Immigrants from Scotland (2.1%, a difference of 0.32%), and Immigrants from Ukraine (2.1%, a difference of 0.33%).
DemographicsRating | RankVision Disability
Poles
92.0
/100
|
#117
Exceptional
2.1%
Immigrants | Philippines
91.4
/100
|
#118
Exceptional
2.1%
Immigrants | Uganda
91.4
/100
|
#119
Exceptional
2.1%
Immigrants | Zimbabwe
91.0
/100
|
#120
Exceptional
2.1%
Immigrants | Scotland
90.4
/100
|
#121
Exceptional
2.1%
Immigrants | Ukraine
90.4
/100
|
#122
Exceptional
2.1%
Immigrants | Albania
90.4
/100
|
#123
Exceptional
2.1%
Immigrants | Spain
89.8
/100
|
#124
Excellent
2.1%
Immigrants | Venezuela
89.8
/100
|
#125
Excellent
2.1%
Immigrants | Peru
89.5
/100
|
#126
Excellent
2.1%
Sudanese
89.2
/100
|
#127
Excellent
2.1%
Immigrants | Chile
89.0
/100
|
#128
Excellent
2.1%
Immigrants | Cameroon
88.8
/100
|
#129
Excellent
2.1%
Immigrants | Kenya
88.7
/100
|
#130
Excellent
2.1%
Immigrants | Hungary
88.7
/100
|
#131
Excellent
2.1%
New Zealanders
88.2
/100
|
#132
Excellent
2.1%
Syrians
87.5
/100
|
#133
Excellent
2.1%
Venezuelans
87.2
/100
|
#134
Excellent
2.1%
Vietnamese
86.7
/100
|
#135
Excellent
2.1%
Czechs
86.3
/100
|
#136
Excellent
2.1%
Immigrants | South Eastern Asia
86.3
/100
|
#137
Excellent
2.1%