Immigrants from Asia vs Immigrants from El Salvador Single Mother Households
COMPARE
Immigrants from Asia
Immigrants from El Salvador
Single Mother Households
Single Mother Households Comparison
Immigrants from Asia
Immigrants from El Salvador
5.6%
SINGLE MOTHER HOUSEHOLDS
98.4/ 100
METRIC RATING
73rd/ 347
METRIC RANK
7.6%
SINGLE MOTHER HOUSEHOLDS
0.0/ 100
METRIC RATING
279th/ 347
METRIC RANK
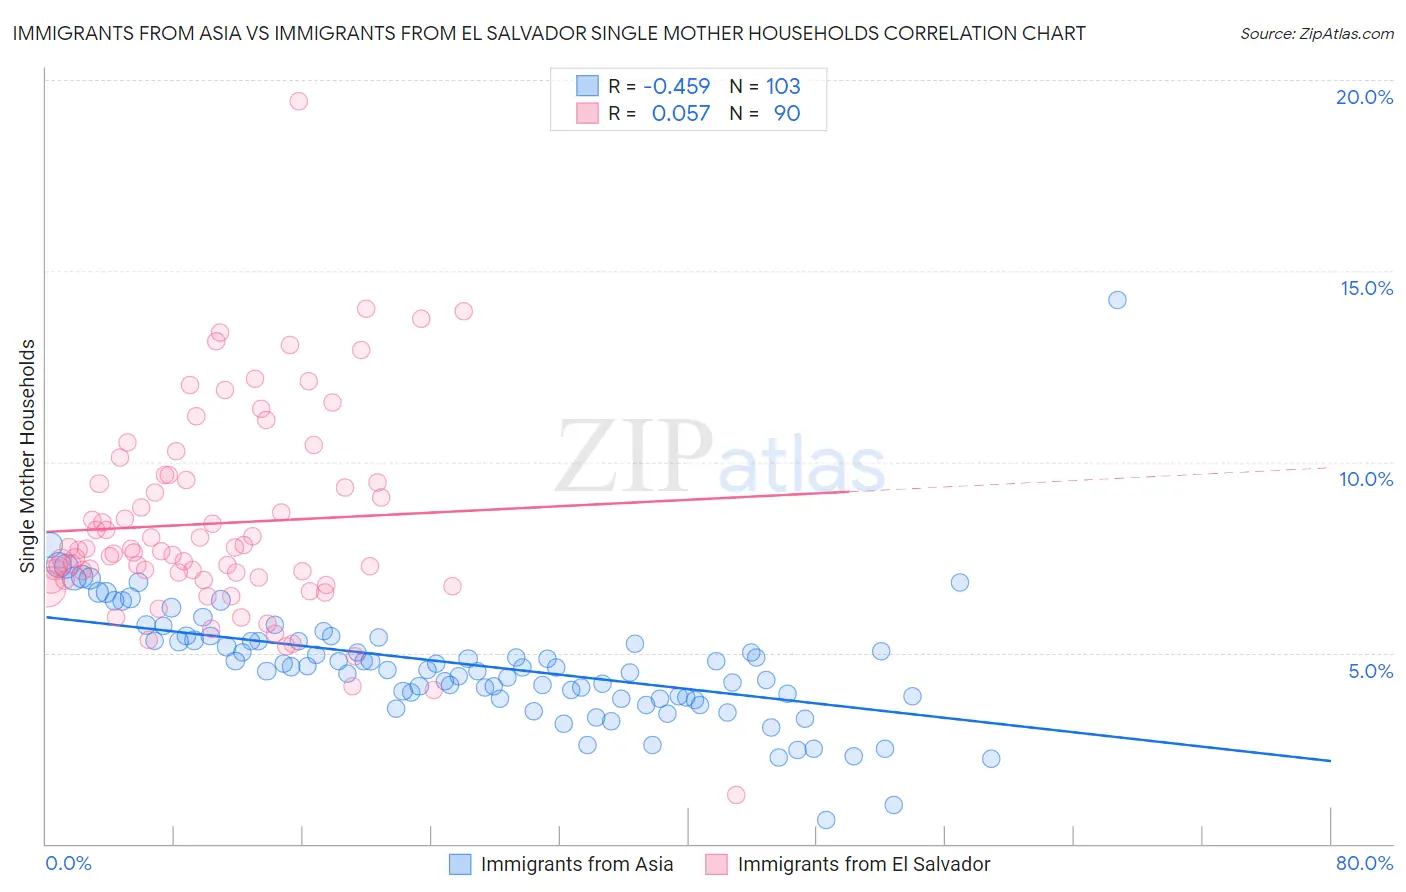
Immigrants from Asia vs Immigrants from El Salvador Single Mother Households Correlation Chart
The statistical analysis conducted on geographies consisting of 545,444,216 people shows a moderate negative correlation between the proportion of Immigrants from Asia and percentage of single mother households in the United States with a correlation coefficient (R) of -0.459 and weighted average of 5.6%. Similarly, the statistical analysis conducted on geographies consisting of 357,280,524 people shows a slight positive correlation between the proportion of Immigrants from El Salvador and percentage of single mother households in the United States with a correlation coefficient (R) of 0.057 and weighted average of 7.6%, a difference of 36.0%.
Single Mother Households Correlation Summary
| Measurement | Immigrants from Asia | Immigrants from El Salvador |
| Minimum | 0.63% | 1.3% |
| Maximum | 14.2% | 19.4% |
| Range | 13.6% | 18.2% |
| Mean | 4.7% | 8.4% |
| Median | 4.6% | 7.7% |
| Interquartile 25% (IQ1) | 3.8% | 6.9% |
| Interquartile 75% (IQ3) | 5.3% | 9.5% |
| Interquartile Range (IQR) | 1.5% | 2.6% |
| Standard Deviation (Sample) | 1.6% | 2.7% |
| Standard Deviation (Population) | 1.6% | 2.7% |
Similar Demographics by Single Mother Households
Demographics Similar to Immigrants from Asia by Single Mother Households
In terms of single mother households, the demographic groups most similar to Immigrants from Asia are Immigrants from North America (5.6%, a difference of 0.030%), Immigrants from Netherlands (5.6%, a difference of 0.060%), Immigrants from Kazakhstan (5.6%, a difference of 0.15%), Immigrants from Eastern Europe (5.6%, a difference of 0.16%), and Slovene (5.6%, a difference of 0.17%).
| Demographics | Rating | Rank | Single Mother Households |
| Immigrants | Canada | 98.5 /100 | #66 | Exceptional 5.6% |
| Italians | 98.5 /100 | #67 | Exceptional 5.6% |
| Immigrants | Bulgaria | 98.5 /100 | #68 | Exceptional 5.6% |
| Asians | 98.5 /100 | #69 | Exceptional 5.6% |
| Immigrants | Eastern Europe | 98.4 /100 | #70 | Exceptional 5.6% |
| Immigrants | Kazakhstan | 98.4 /100 | #71 | Exceptional 5.6% |
| Immigrants | Netherlands | 98.4 /100 | #72 | Exceptional 5.6% |
| Immigrants | Asia | 98.4 /100 | #73 | Exceptional 5.6% |
| Immigrants | North America | 98.3 /100 | #74 | Exceptional 5.6% |
| Slovenes | 98.3 /100 | #75 | Exceptional 5.6% |
| New Zealanders | 98.2 /100 | #76 | Exceptional 5.6% |
| Romanians | 98.1 /100 | #77 | Exceptional 5.6% |
| Swiss | 98.1 /100 | #78 | Exceptional 5.6% |
| Immigrants | Sri Lanka | 98.0 /100 | #79 | Exceptional 5.6% |
| Czechs | 97.9 /100 | #80 | Exceptional 5.6% |
Demographics Similar to Immigrants from El Salvador by Single Mother Households
In terms of single mother households, the demographic groups most similar to Immigrants from El Salvador are Central American (7.6%, a difference of 0.22%), Immigrants from Trinidad and Tobago (7.6%, a difference of 0.23%), Guyanese (7.6%, a difference of 0.27%), Immigrants from Sierra Leone (7.7%, a difference of 0.52%), and Immigrants from Laos (7.7%, a difference of 0.52%).
| Demographics | Rating | Rank | Single Mother Households |
| Immigrants | Azores | 0.1 /100 | #272 | Tragic 7.5% |
| Belizeans | 0.1 /100 | #273 | Tragic 7.6% |
| Immigrants | Guyana | 0.1 /100 | #274 | Tragic 7.6% |
| Central American Indians | 0.1 /100 | #275 | Tragic 7.6% |
| Guyanese | 0.1 /100 | #276 | Tragic 7.6% |
| Immigrants | Trinidad and Tobago | 0.1 /100 | #277 | Tragic 7.6% |
| Central Americans | 0.1 /100 | #278 | Tragic 7.6% |
| Immigrants | El Salvador | 0.0 /100 | #279 | Tragic 7.6% |
| Immigrants | Sierra Leone | 0.0 /100 | #280 | Tragic 7.7% |
| Immigrants | Laos | 0.0 /100 | #281 | Tragic 7.7% |
| Guatemalans | 0.0 /100 | #282 | Tragic 7.7% |
| Nigerians | 0.0 /100 | #283 | Tragic 7.7% |
| Immigrants | Belize | 0.0 /100 | #284 | Tragic 7.7% |
| Trinidadians and Tobagonians | 0.0 /100 | #285 | Tragic 7.7% |
| Immigrants | Middle Africa | 0.0 /100 | #286 | Tragic 7.7% |