Apache vs Immigrants from El Salvador Single Mother Households
COMPARE
Apache
Immigrants from El Salvador
Single Mother Households
Single Mother Households Comparison
Apache
Immigrants from El Salvador
7.9%
SINGLE MOTHER HOUSEHOLDS
0.0/ 100
METRIC RATING
294th/ 347
METRIC RANK
7.6%
SINGLE MOTHER HOUSEHOLDS
0.0/ 100
METRIC RATING
279th/ 347
METRIC RANK
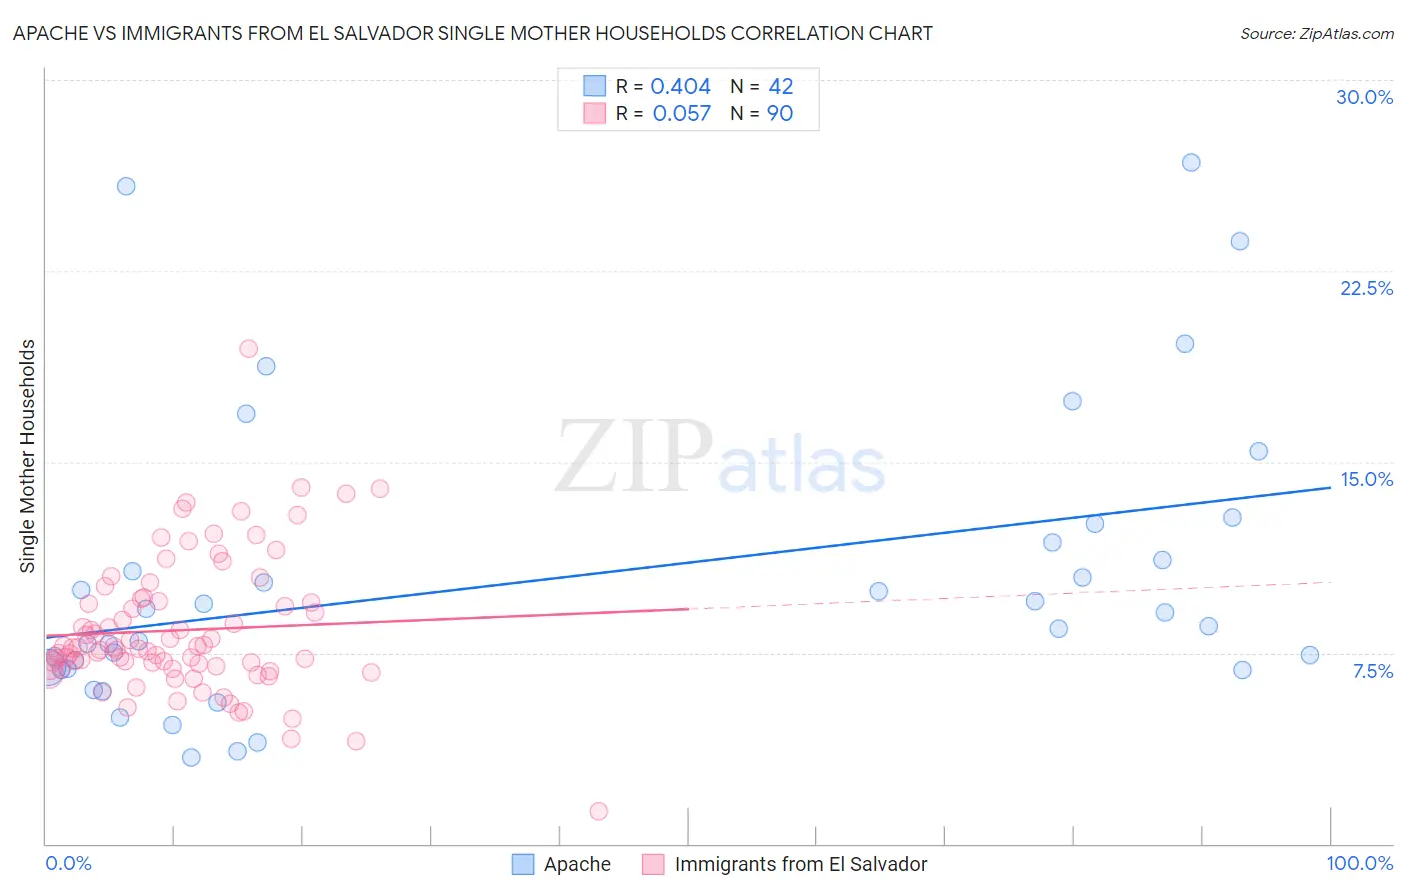
Apache vs Immigrants from El Salvador Single Mother Households Correlation Chart
The statistical analysis conducted on geographies consisting of 230,770,959 people shows a moderate positive correlation between the proportion of Apache and percentage of single mother households in the United States with a correlation coefficient (R) of 0.404 and weighted average of 7.9%. Similarly, the statistical analysis conducted on geographies consisting of 357,280,524 people shows a slight positive correlation between the proportion of Immigrants from El Salvador and percentage of single mother households in the United States with a correlation coefficient (R) of 0.057 and weighted average of 7.6%, a difference of 3.4%.
Single Mother Households Correlation Summary
| Measurement | Apache | Immigrants from El Salvador |
| Minimum | 3.4% | 1.3% |
| Maximum | 26.8% | 19.4% |
| Range | 23.4% | 18.2% |
| Mean | 10.4% | 8.4% |
| Median | 8.8% | 7.7% |
| Interquartile 25% (IQ1) | 6.9% | 6.9% |
| Interquartile 75% (IQ3) | 11.8% | 9.5% |
| Interquartile Range (IQR) | 5.0% | 2.6% |
| Standard Deviation (Sample) | 5.7% | 2.7% |
| Standard Deviation (Population) | 5.7% | 2.7% |
Demographics Similar to Apache and Immigrants from El Salvador by Single Mother Households
In terms of single mother households, the demographic groups most similar to Apache are Immigrants from Cameroon (7.9%, a difference of 0.10%), Barbadian (7.9%, a difference of 0.29%), Immigrants from Latin America (7.9%, a difference of 0.35%), Ghanaian (7.8%, a difference of 0.46%), and West Indian (7.8%, a difference of 0.47%). Similarly, the demographic groups most similar to Immigrants from El Salvador are Central American (7.6%, a difference of 0.22%), Immigrants from Trinidad and Tobago (7.6%, a difference of 0.23%), Guyanese (7.6%, a difference of 0.27%), Immigrants from Sierra Leone (7.7%, a difference of 0.52%), and Immigrants from Laos (7.7%, a difference of 0.52%).
| Demographics | Rating | Rank | Single Mother Households |
| Guyanese | 0.1 /100 | #276 | Tragic 7.6% |
| Immigrants | Trinidad and Tobago | 0.1 /100 | #277 | Tragic 7.6% |
| Central Americans | 0.1 /100 | #278 | Tragic 7.6% |
| Immigrants | El Salvador | 0.0 /100 | #279 | Tragic 7.6% |
| Immigrants | Sierra Leone | 0.0 /100 | #280 | Tragic 7.7% |
| Immigrants | Laos | 0.0 /100 | #281 | Tragic 7.7% |
| Guatemalans | 0.0 /100 | #282 | Tragic 7.7% |
| Nigerians | 0.0 /100 | #283 | Tragic 7.7% |
| Immigrants | Belize | 0.0 /100 | #284 | Tragic 7.7% |
| Trinidadians and Tobagonians | 0.0 /100 | #285 | Tragic 7.7% |
| Immigrants | Middle Africa | 0.0 /100 | #286 | Tragic 7.7% |
| Immigrants | Guatemala | 0.0 /100 | #287 | Tragic 7.7% |
| Sierra Leoneans | 0.0 /100 | #288 | Tragic 7.7% |
| Sub-Saharan Africans | 0.0 /100 | #289 | Tragic 7.8% |
| Immigrants | Nigeria | 0.0 /100 | #290 | Tragic 7.8% |
| West Indians | 0.0 /100 | #291 | Tragic 7.8% |
| Ghanaians | 0.0 /100 | #292 | Tragic 7.8% |
| Immigrants | Cameroon | 0.0 /100 | #293 | Tragic 7.9% |
| Apache | 0.0 /100 | #294 | Tragic 7.9% |
| Barbadians | 0.0 /100 | #295 | Tragic 7.9% |
| Immigrants | Latin America | 0.0 /100 | #296 | Tragic 7.9% |