Immigrants from South Central Asia vs Immigrants from Zimbabwe Married-couple Households
COMPARE
Immigrants from South Central Asia
Immigrants from Zimbabwe
Married-couple Households
Married-couple Households Comparison
Immigrants from South Central Asia
Immigrants from Zimbabwe
50.6%
MARRIED-COUPLE HOUSEHOLDS
100.0/ 100
METRIC RATING
8th/ 347
METRIC RANK
46.3%
MARRIED-COUPLE HOUSEHOLDS
43.0/ 100
METRIC RATING
179th/ 347
METRIC RANK
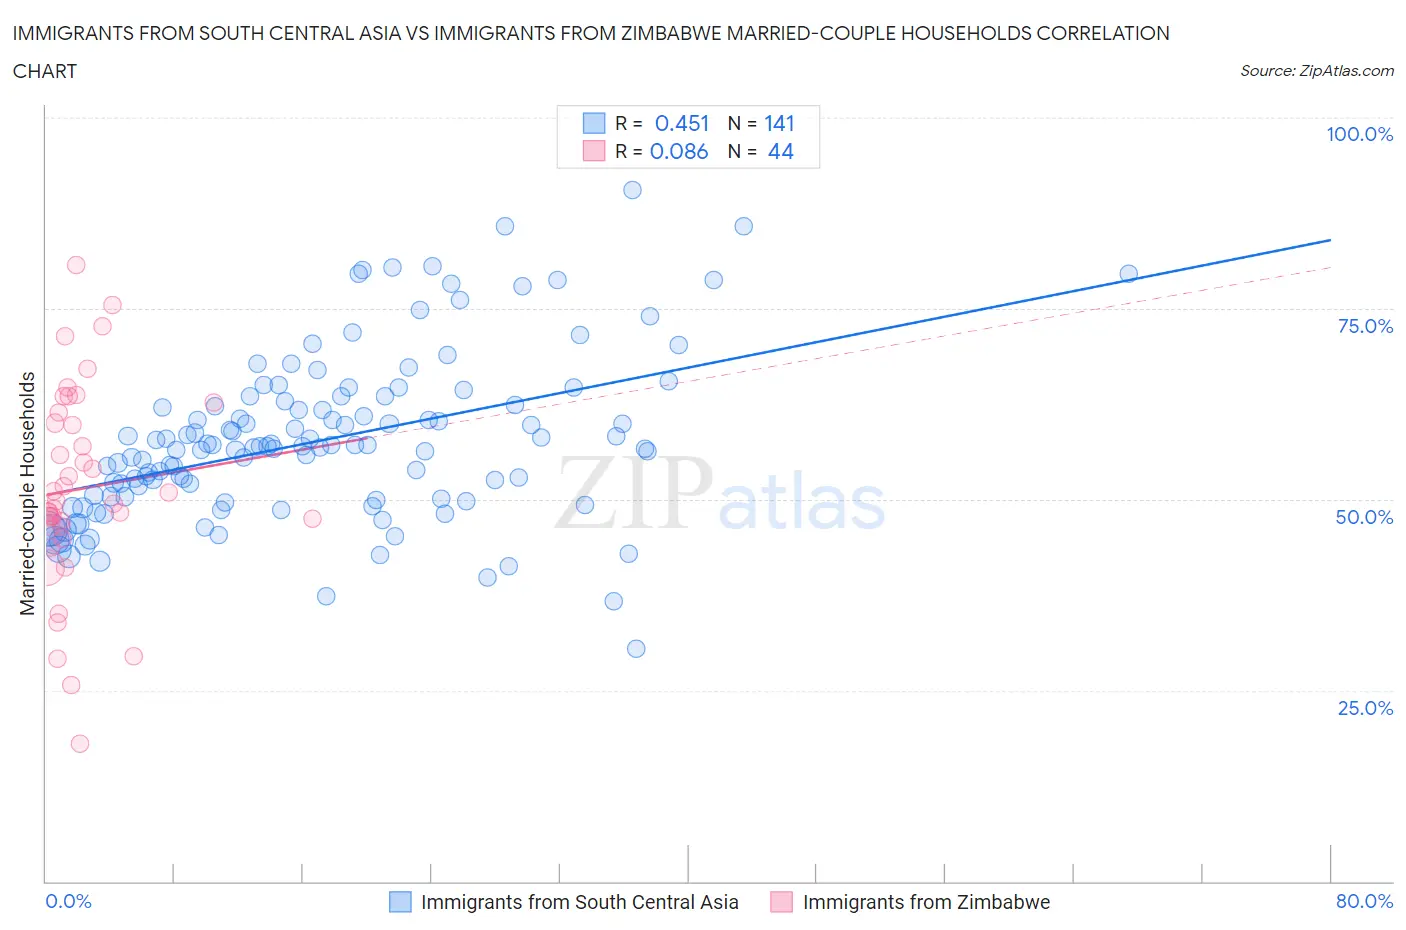
Immigrants from South Central Asia vs Immigrants from Zimbabwe Married-couple Households Correlation Chart
The statistical analysis conducted on geographies consisting of 472,645,847 people shows a moderate positive correlation between the proportion of Immigrants from South Central Asia and percentage of married-couple family households in the United States with a correlation coefficient (R) of 0.451 and weighted average of 50.6%. Similarly, the statistical analysis conducted on geographies consisting of 117,791,116 people shows a slight positive correlation between the proportion of Immigrants from Zimbabwe and percentage of married-couple family households in the United States with a correlation coefficient (R) of 0.086 and weighted average of 46.3%, a difference of 9.3%.
Married-couple Households Correlation Summary
| Measurement | Immigrants from South Central Asia | Immigrants from Zimbabwe |
| Minimum | 30.4% | 17.9% |
| Maximum | 90.5% | 80.8% |
| Range | 60.1% | 62.8% |
| Mean | 57.6% | 51.4% |
| Median | 56.9% | 49.6% |
| Interquartile 25% (IQ1) | 50.0% | 46.4% |
| Interquartile 75% (IQ3) | 62.5% | 60.6% |
| Interquartile Range (IQR) | 12.5% | 14.2% |
| Standard Deviation (Sample) | 10.8% | 13.1% |
| Standard Deviation (Population) | 10.8% | 13.0% |
Similar Demographics by Married-couple Households
Demographics Similar to Immigrants from South Central Asia by Married-couple Households
In terms of married-couple households, the demographic groups most similar to Immigrants from South Central Asia are Pennsylvania German (50.4%, a difference of 0.55%), Chinese (50.4%, a difference of 0.55%), Filipino (51.0%, a difference of 0.64%), Danish (51.1%, a difference of 0.86%), and Immigrants from Pakistan (50.1%, a difference of 1.0%).
| Demographics | Rating | Rank | Married-couple Households |
| Immigrants | India | 100.0 /100 | #1 | Exceptional 52.7% |
| Immigrants | Taiwan | 100.0 /100 | #2 | Exceptional 52.4% |
| Thais | 100.0 /100 | #3 | Exceptional 51.9% |
| Assyrians/Chaldeans/Syriacs | 100.0 /100 | #4 | Exceptional 51.8% |
| Tongans | 100.0 /100 | #5 | Exceptional 51.6% |
| Danes | 100.0 /100 | #6 | Exceptional 51.1% |
| Filipinos | 100.0 /100 | #7 | Exceptional 51.0% |
| Immigrants | South Central Asia | 100.0 /100 | #8 | Exceptional 50.6% |
| Pennsylvania Germans | 100.0 /100 | #9 | Exceptional 50.4% |
| Chinese | 100.0 /100 | #10 | Exceptional 50.4% |
| Immigrants | Pakistan | 100.0 /100 | #11 | Exceptional 50.1% |
| Swiss | 100.0 /100 | #12 | Exceptional 49.9% |
| Immigrants | Korea | 100.0 /100 | #13 | Exceptional 49.9% |
| Burmese | 100.0 /100 | #14 | Exceptional 49.8% |
| Koreans | 99.9 /100 | #15 | Exceptional 49.7% |
Demographics Similar to Immigrants from Zimbabwe by Married-couple Households
In terms of married-couple households, the demographic groups most similar to Immigrants from Zimbabwe are Immigrants from Costa Rica (46.3%, a difference of 0.010%), Immigrants (46.3%, a difference of 0.030%), Mongolian (46.3%, a difference of 0.040%), Malaysian (46.3%, a difference of 0.050%), and Cajun (46.4%, a difference of 0.090%).
| Demographics | Rating | Rank | Married-couple Households |
| Immigrants | Australia | 54.6 /100 | #172 | Average 46.5% |
| Immigrants | Norway | 52.0 /100 | #173 | Average 46.5% |
| Immigrants | Mexico | 50.0 /100 | #174 | Average 46.4% |
| Immigrants | Colombia | 46.1 /100 | #175 | Average 46.4% |
| Cajuns | 45.2 /100 | #176 | Average 46.4% |
| Immigrants | Immigrants | 43.8 /100 | #177 | Average 46.3% |
| Immigrants | Costa Rica | 43.4 /100 | #178 | Average 46.3% |
| Immigrants | Zimbabwe | 43.0 /100 | #179 | Average 46.3% |
| Mongolians | 42.0 /100 | #180 | Average 46.3% |
| Malaysians | 41.8 /100 | #181 | Average 46.3% |
| Yugoslavians | 38.9 /100 | #182 | Fair 46.2% |
| Immigrants | Brazil | 38.3 /100 | #183 | Fair 46.2% |
| Immigrants | Switzerland | 36.9 /100 | #184 | Fair 46.2% |
| Brazilians | 35.9 /100 | #185 | Fair 46.2% |
| Albanians | 31.1 /100 | #186 | Fair 46.1% |