Immigrants from Dominica vs Immigrants from Latin America Births to Unmarried Women
COMPARE
Immigrants from Dominica
Immigrants from Latin America
Births to Unmarried Women
Births to Unmarried Women Comparison
Immigrants from Dominica
Immigrants from Latin America
39.5%
BIRTHS TO UNMARRIED WOMEN
0.0/ 100
METRIC RATING
310th/ 347
METRIC RANK
37.1%
BIRTHS TO UNMARRIED WOMEN
0.1/ 100
METRIC RATING
278th/ 347
METRIC RANK
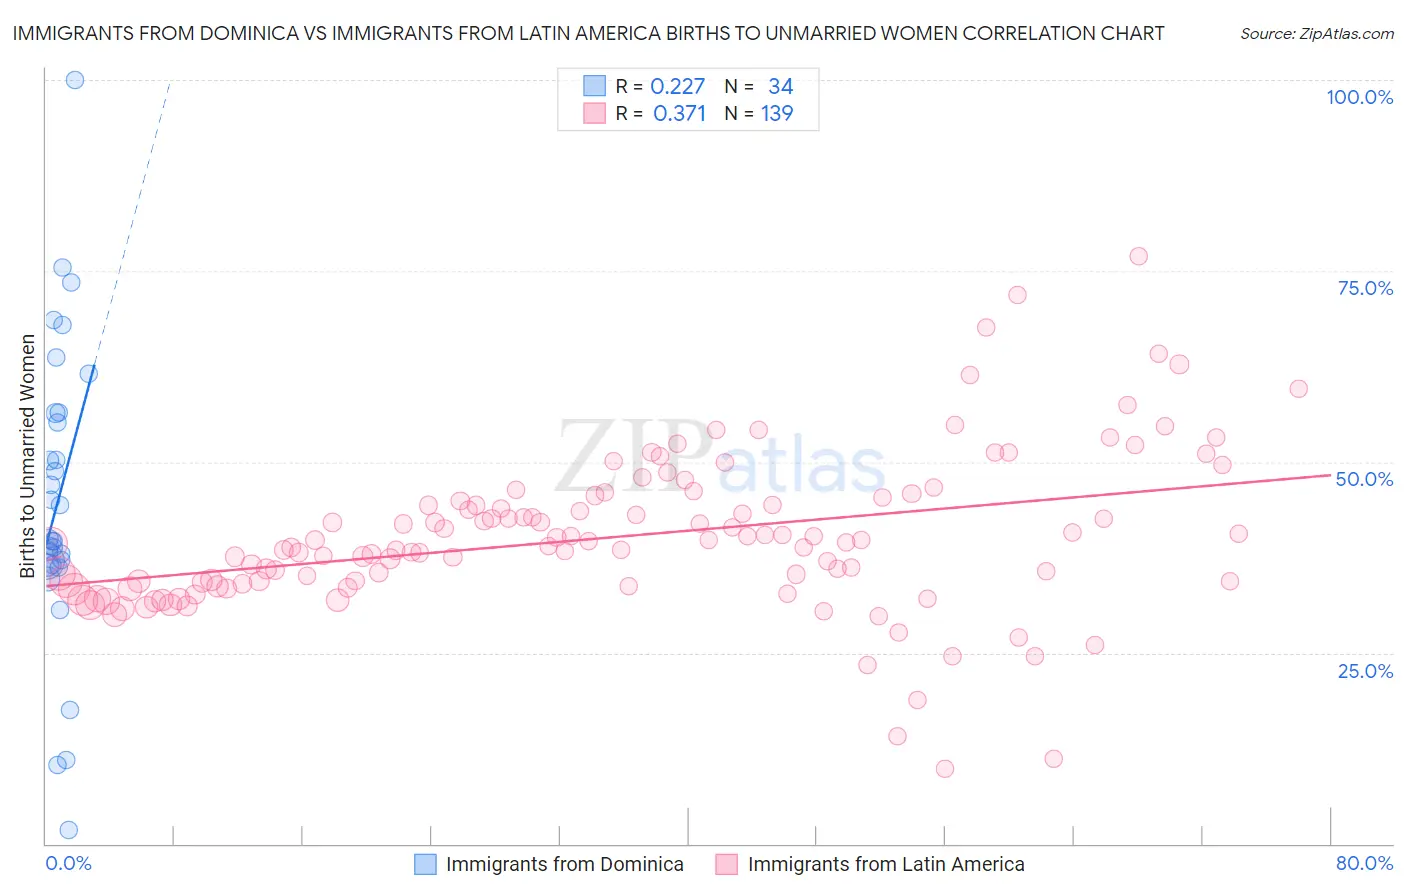
Immigrants from Dominica vs Immigrants from Latin America Births to Unmarried Women Correlation Chart
The statistical analysis conducted on geographies consisting of 82,693,898 people shows a weak positive correlation between the proportion of Immigrants from Dominica and percentage of births to unmarried women in the United States with a correlation coefficient (R) of 0.227 and weighted average of 39.5%. Similarly, the statistical analysis conducted on geographies consisting of 501,046,047 people shows a mild positive correlation between the proportion of Immigrants from Latin America and percentage of births to unmarried women in the United States with a correlation coefficient (R) of 0.371 and weighted average of 37.1%, a difference of 6.3%.
Births to Unmarried Women Correlation Summary
| Measurement | Immigrants from Dominica | Immigrants from Latin America |
| Minimum | 1.8% | 9.8% |
| Maximum | 100.0% | 77.0% |
| Range | 98.2% | 67.2% |
| Mean | 44.9% | 40.1% |
| Median | 39.8% | 39.4% |
| Interquartile 25% (IQ1) | 36.5% | 34.1% |
| Interquartile 75% (IQ3) | 56.4% | 44.9% |
| Interquartile Range (IQR) | 19.9% | 10.7% |
| Standard Deviation (Sample) | 19.7% | 10.3% |
| Standard Deviation (Population) | 19.4% | 10.3% |
Similar Demographics by Births to Unmarried Women
Demographics Similar to Immigrants from Dominica by Births to Unmarried Women
In terms of births to unmarried women, the demographic groups most similar to Immigrants from Dominica are Cuban (39.4%, a difference of 0.22%), Immigrants from the Azores (39.6%, a difference of 0.23%), U.S. Virgin Islander (39.6%, a difference of 0.25%), Aleut (39.3%, a difference of 0.34%), and Immigrants from Honduras (39.3%, a difference of 0.43%).
| Demographics | Rating | Rank | Births to Unmarried Women |
| Immigrants | Jamaica | 0.0 /100 | #303 | Tragic 38.8% |
| Yaqui | 0.0 /100 | #304 | Tragic 38.8% |
| Immigrants | Haiti | 0.0 /100 | #305 | Tragic 38.9% |
| Central American Indians | 0.0 /100 | #306 | Tragic 39.0% |
| Immigrants | Honduras | 0.0 /100 | #307 | Tragic 39.3% |
| Aleuts | 0.0 /100 | #308 | Tragic 39.3% |
| Cubans | 0.0 /100 | #309 | Tragic 39.4% |
| Immigrants | Dominica | 0.0 /100 | #310 | Tragic 39.5% |
| Immigrants | Azores | 0.0 /100 | #311 | Tragic 39.6% |
| U.S. Virgin Islanders | 0.0 /100 | #312 | Tragic 39.6% |
| Africans | 0.0 /100 | #313 | Tragic 39.7% |
| Immigrants | Caribbean | 0.0 /100 | #314 | Tragic 39.8% |
| Dominicans | 0.0 /100 | #315 | Tragic 39.8% |
| Apache | 0.0 /100 | #316 | Tragic 39.9% |
| Immigrants | Dominican Republic | 0.0 /100 | #317 | Tragic 40.1% |
Demographics Similar to Immigrants from Latin America by Births to Unmarried Women
In terms of births to unmarried women, the demographic groups most similar to Immigrants from Latin America are Guatemalan (37.1%, a difference of 0.090%), Belizean (37.0%, a difference of 0.30%), West Indian (37.3%, a difference of 0.33%), Immigrants from St. Vincent and the Grenadines (37.3%, a difference of 0.45%), and Immigrants from Belize (37.3%, a difference of 0.47%).
| Demographics | Rating | Rank | Births to Unmarried Women |
| Immigrants | Barbados | 0.1 /100 | #271 | Tragic 36.8% |
| Choctaw | 0.1 /100 | #272 | Tragic 36.9% |
| Mexicans | 0.1 /100 | #273 | Tragic 36.9% |
| Cree | 0.1 /100 | #274 | Tragic 37.0% |
| Barbadians | 0.1 /100 | #275 | Tragic 37.0% |
| Belizeans | 0.1 /100 | #276 | Tragic 37.0% |
| Guatemalans | 0.1 /100 | #277 | Tragic 37.1% |
| Immigrants | Latin America | 0.1 /100 | #278 | Tragic 37.1% |
| West Indians | 0.1 /100 | #279 | Tragic 37.3% |
| Immigrants | St. Vincent and the Grenadines | 0.1 /100 | #280 | Tragic 37.3% |
| Immigrants | Belize | 0.1 /100 | #281 | Tragic 37.3% |
| Liberians | 0.0 /100 | #282 | Tragic 37.4% |
| Spanish American Indians | 0.0 /100 | #283 | Tragic 37.4% |
| Immigrants | Central America | 0.0 /100 | #284 | Tragic 37.4% |
| Immigrants | Mexico | 0.0 /100 | #285 | Tragic 37.5% |