Immigrants from South America vs Immigrants from Sweden Average Family Size
COMPARE
Immigrants from South America
Immigrants from Sweden
Average Family Size
Average Family Size Comparison
Immigrants from South America
Immigrants from Sweden
3.27
AVERAGE FAMILY SIZE
95.0/ 100
METRIC RATING
116th/ 347
METRIC RANK
3.14
AVERAGE FAMILY SIZE
0.2/ 100
METRIC RATING
300th/ 347
METRIC RANK
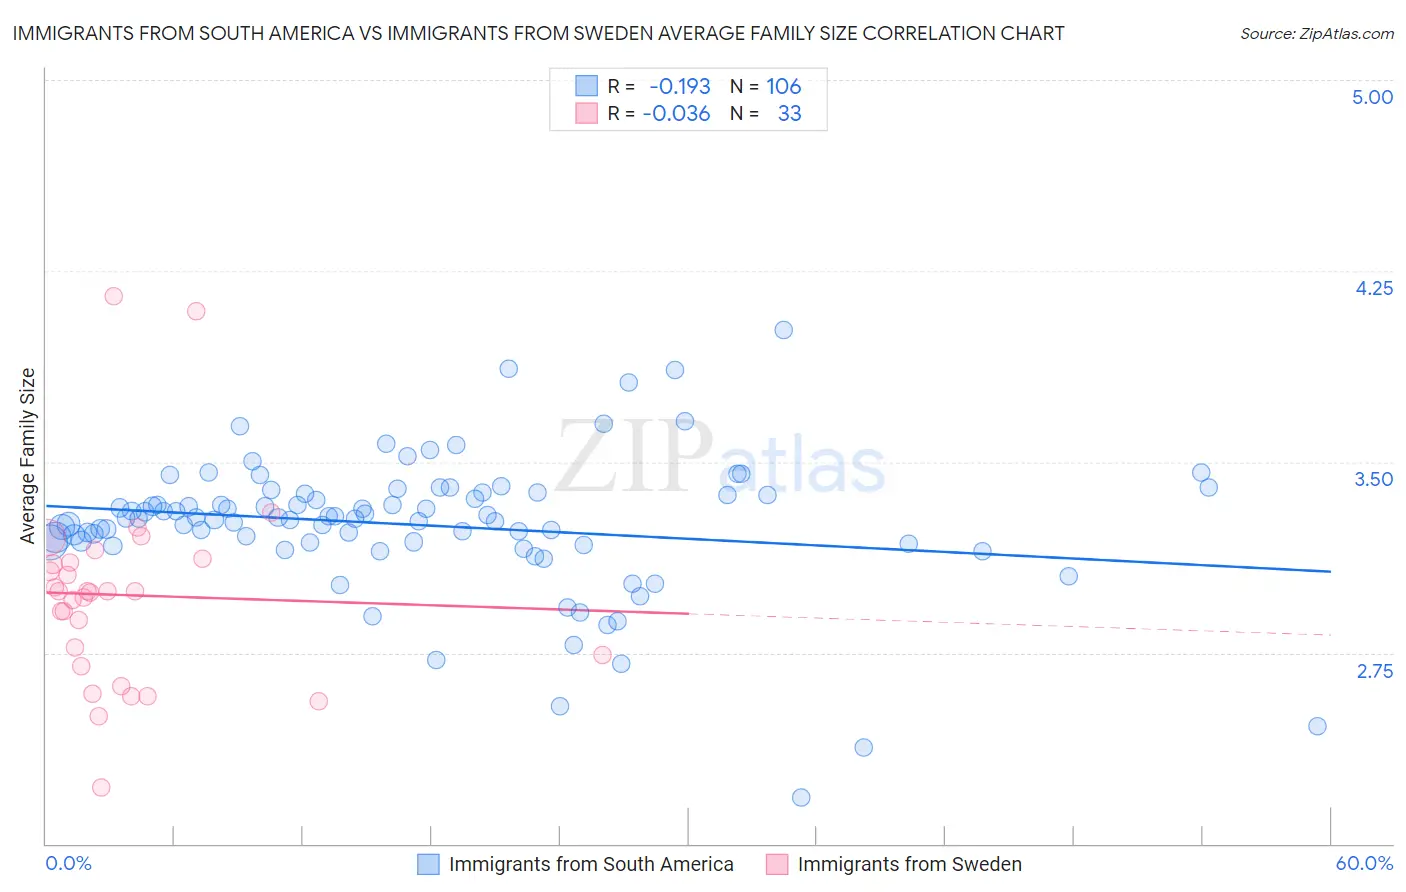
Immigrants from South America vs Immigrants from Sweden Average Family Size Correlation Chart
The statistical analysis conducted on geographies consisting of 486,031,470 people shows a poor negative correlation between the proportion of Immigrants from South America and average family size in the United States with a correlation coefficient (R) of -0.193 and weighted average of 3.27. Similarly, the statistical analysis conducted on geographies consisting of 164,705,218 people shows no correlation between the proportion of Immigrants from Sweden and average family size in the United States with a correlation coefficient (R) of -0.036 and weighted average of 3.14, a difference of 4.3%.
Average Family Size Correlation Summary
| Measurement | Immigrants from South America | Immigrants from Sweden |
| Minimum | 2.18 | 2.22 |
| Maximum | 4.02 | 4.15 |
| Range | 1.84 | 1.93 |
| Mean | 3.25 | 2.98 |
| Median | 3.28 | 2.99 |
| Interquartile 25% (IQ1) | 3.18 | 2.72 |
| Interquartile 75% (IQ3) | 3.37 | 3.11 |
| Interquartile Range (IQR) | 0.19 | 0.39 |
| Standard Deviation (Sample) | 0.28 | 0.39 |
| Standard Deviation (Population) | 0.27 | 0.38 |
Similar Demographics by Average Family Size
Demographics Similar to Immigrants from South America by Average Family Size
In terms of average family size, the demographic groups most similar to Immigrants from South America are Immigrants from Liberia (3.27, a difference of 0.0%), South American (3.27, a difference of 0.010%), Kiowa (3.27, a difference of 0.020%), Immigrants from Panama (3.27, a difference of 0.060%), and Black/African American (3.27, a difference of 0.070%).
| Demographics | Rating | Rank | Average Family Size |
| Puerto Ricans | 96.7 /100 | #109 | Exceptional 3.28 |
| Bahamians | 96.6 /100 | #110 | Exceptional 3.28 |
| Indonesians | 96.2 /100 | #111 | Exceptional 3.28 |
| Blacks/African Americans | 95.7 /100 | #112 | Exceptional 3.27 |
| Immigrants | Panama | 95.6 /100 | #113 | Exceptional 3.27 |
| South Americans | 95.1 /100 | #114 | Exceptional 3.27 |
| Immigrants | Liberia | 95.0 /100 | #115 | Exceptional 3.27 |
| Immigrants | South America | 95.0 /100 | #116 | Exceptional 3.27 |
| Kiowa | 94.8 /100 | #117 | Exceptional 3.27 |
| Immigrants | Asia | 94.0 /100 | #118 | Exceptional 3.27 |
| Immigrants | Indonesia | 93.7 /100 | #119 | Exceptional 3.27 |
| Immigrants | Bahamas | 93.6 /100 | #120 | Exceptional 3.27 |
| Immigrants | Thailand | 93.3 /100 | #121 | Exceptional 3.27 |
| Immigrants | Colombia | 92.8 /100 | #122 | Exceptional 3.27 |
| Alaskan Athabascans | 92.4 /100 | #123 | Exceptional 3.27 |
Demographics Similar to Immigrants from Sweden by Average Family Size
In terms of average family size, the demographic groups most similar to Immigrants from Sweden are Canadian (3.14, a difference of 0.010%), Immigrants from Western Europe (3.14, a difference of 0.060%), Colville (3.14, a difference of 0.060%), Immigrants from Croatia (3.14, a difference of 0.070%), and Austrian (3.14, a difference of 0.070%).
| Demographics | Rating | Rank | Average Family Size |
| Scandinavians | 0.2 /100 | #293 | Tragic 3.14 |
| Immigrants | Croatia | 0.2 /100 | #294 | Tragic 3.14 |
| Austrians | 0.2 /100 | #295 | Tragic 3.14 |
| Ukrainians | 0.2 /100 | #296 | Tragic 3.14 |
| Immigrants | Western Europe | 0.2 /100 | #297 | Tragic 3.14 |
| Colville | 0.2 /100 | #298 | Tragic 3.14 |
| Canadians | 0.2 /100 | #299 | Tragic 3.14 |
| Immigrants | Sweden | 0.2 /100 | #300 | Tragic 3.14 |
| Macedonians | 0.2 /100 | #301 | Tragic 3.13 |
| Immigrants | Latvia | 0.2 /100 | #302 | Tragic 3.13 |
| British | 0.2 /100 | #303 | Tragic 3.13 |
| Immigrants | Switzerland | 0.2 /100 | #304 | Tragic 3.13 |
| Australians | 0.1 /100 | #305 | Tragic 3.13 |
| Immigrants | Ireland | 0.1 /100 | #306 | Tragic 3.13 |
| Immigrants | Serbia | 0.1 /100 | #307 | Tragic 3.13 |