Immigrants from South America vs Immigrants from Sweden In Labor Force | Age 20-64
COMPARE
Immigrants from South America
Immigrants from Sweden
In Labor Force | Age 20-64
In Labor Force | Age 20-64 Comparison
Immigrants from South America
Immigrants from Sweden
80.0%
IN LABOR FORCE | AGE 20-64
93.9/ 100
METRIC RATING
111th/ 347
METRIC RANK
79.8%
IN LABOR FORCE | AGE 20-64
79.7/ 100
METRIC RATING
143rd/ 347
METRIC RANK
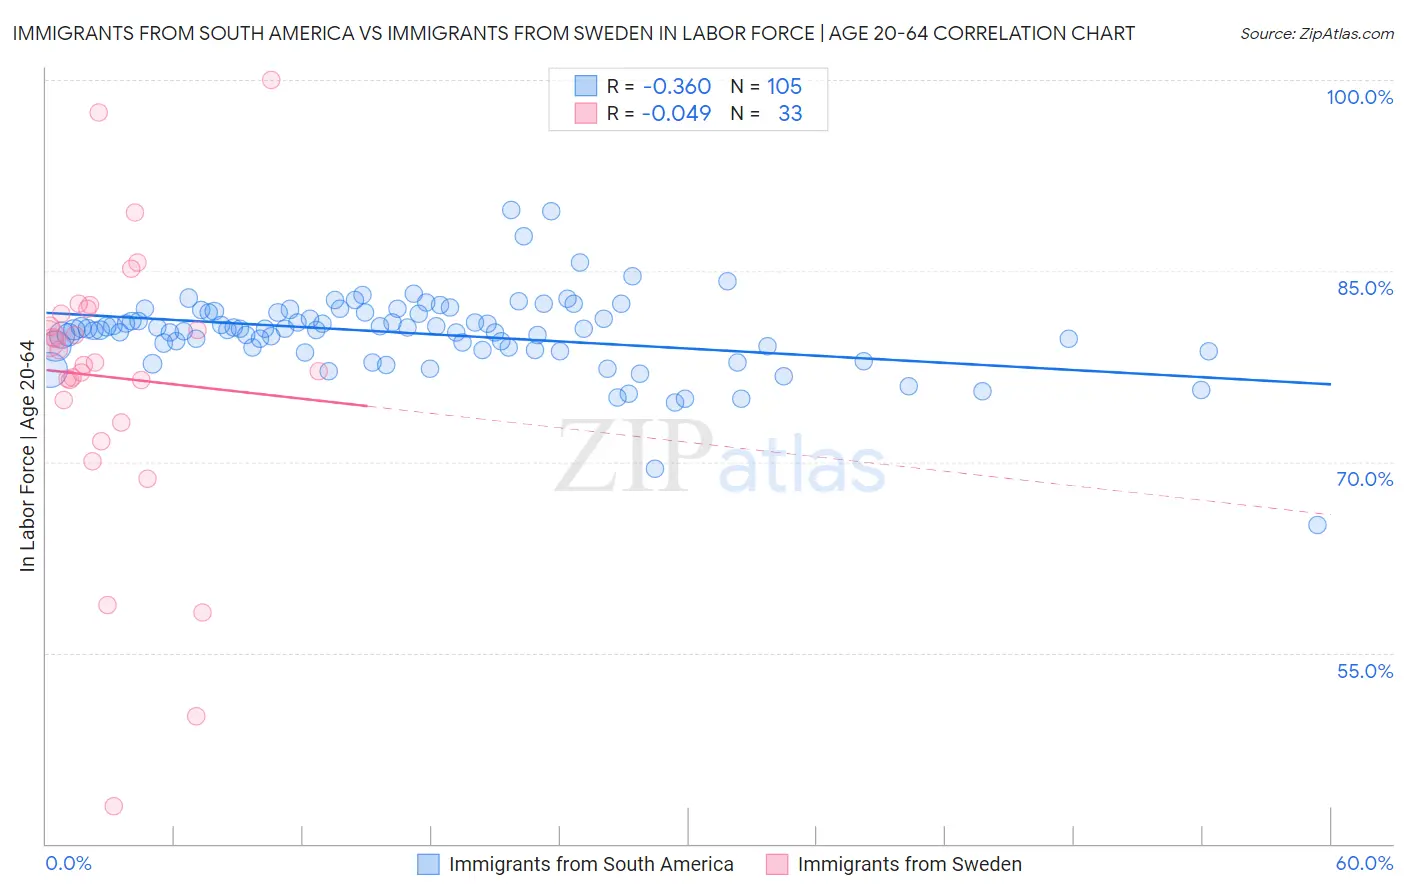
Immigrants from South America vs Immigrants from Sweden In Labor Force | Age 20-64 Correlation Chart
The statistical analysis conducted on geographies consisting of 486,405,398 people shows a mild negative correlation between the proportion of Immigrants from South America and labor force participation rate among population between the ages 20 and 64 in the United States with a correlation coefficient (R) of -0.360 and weighted average of 80.0%. Similarly, the statistical analysis conducted on geographies consisting of 164,749,668 people shows no correlation between the proportion of Immigrants from Sweden and labor force participation rate among population between the ages 20 and 64 in the United States with a correlation coefficient (R) of -0.049 and weighted average of 79.8%, a difference of 0.27%.
In Labor Force | Age 20-64 Correlation Summary
| Measurement | Immigrants from South America | Immigrants from Sweden |
| Minimum | 65.0% | 42.9% |
| Maximum | 89.8% | 100.0% |
| Range | 24.8% | 57.1% |
| Mean | 80.1% | 76.6% |
| Median | 80.4% | 77.8% |
| Interquartile 25% (IQ1) | 78.9% | 74.0% |
| Interquartile 75% (IQ3) | 81.7% | 81.8% |
| Interquartile Range (IQR) | 2.9% | 7.8% |
| Standard Deviation (Sample) | 3.2% | 11.4% |
| Standard Deviation (Population) | 3.2% | 11.2% |
Similar Demographics by In Labor Force | Age 20-64
Demographics Similar to Immigrants from South America by In Labor Force | Age 20-64
In terms of in labor force | age 20-64, the demographic groups most similar to Immigrants from South America are Estonian (80.0%, a difference of 0.0%), Immigrants from Italy (80.0%, a difference of 0.0%), Sri Lankan (80.0%, a difference of 0.0%), Iranian (80.0%, a difference of 0.010%), and Immigrants from Argentina (80.0%, a difference of 0.010%).
| Demographics | Rating | Rank | In Labor Force | Age 20-64 |
| Venezuelans | 95.3 /100 | #104 | Exceptional 80.0% |
| Immigrants | Ghana | 95.0 /100 | #105 | Exceptional 80.0% |
| Greeks | 94.8 /100 | #106 | Exceptional 80.0% |
| Immigrants | Jordan | 94.8 /100 | #107 | Exceptional 80.0% |
| Iranians | 94.3 /100 | #108 | Exceptional 80.0% |
| Immigrants | Argentina | 94.1 /100 | #109 | Exceptional 80.0% |
| Estonians | 94.0 /100 | #110 | Exceptional 80.0% |
| Immigrants | South America | 93.9 /100 | #111 | Exceptional 80.0% |
| Immigrants | Italy | 93.9 /100 | #112 | Exceptional 80.0% |
| Sri Lankans | 93.9 /100 | #113 | Exceptional 80.0% |
| Argentineans | 93.8 /100 | #114 | Exceptional 80.0% |
| Bermudans | 93.3 /100 | #115 | Exceptional 80.0% |
| Immigrants | Western Africa | 93.1 /100 | #116 | Exceptional 80.0% |
| Immigrants | Vietnam | 92.7 /100 | #117 | Exceptional 80.0% |
| Cape Verdeans | 92.7 /100 | #118 | Exceptional 80.0% |
Demographics Similar to Immigrants from Sweden by In Labor Force | Age 20-64
In terms of in labor force | age 20-64, the demographic groups most similar to Immigrants from Sweden are Immigrants from Israel (79.8%, a difference of 0.0%), Slovak (79.8%, a difference of 0.0%), Korean (79.8%, a difference of 0.0%), Immigrants from South Eastern Asia (79.8%, a difference of 0.010%), and Pakistani (79.8%, a difference of 0.010%).
| Demographics | Rating | Rank | In Labor Force | Age 20-64 |
| Immigrants | Singapore | 86.7 /100 | #136 | Excellent 79.9% |
| Immigrants | Ukraine | 86.5 /100 | #137 | Excellent 79.9% |
| Immigrants | Nigeria | 86.4 /100 | #138 | Excellent 79.9% |
| Immigrants | Spain | 83.9 /100 | #139 | Excellent 79.8% |
| Immigrants | South Eastern Asia | 80.4 /100 | #140 | Excellent 79.8% |
| Immigrants | Israel | 80.0 /100 | #141 | Good 79.8% |
| Slovaks | 79.9 /100 | #142 | Good 79.8% |
| Immigrants | Sweden | 79.7 /100 | #143 | Good 79.8% |
| Koreans | 79.6 /100 | #144 | Good 79.8% |
| Pakistanis | 79.3 /100 | #145 | Good 79.8% |
| Immigrants | Southern Europe | 78.9 /100 | #146 | Good 79.8% |
| Immigrants | Philippines | 78.0 /100 | #147 | Good 79.8% |
| Romanians | 77.6 /100 | #148 | Good 79.8% |
| Icelanders | 75.1 /100 | #149 | Good 79.7% |
| Costa Ricans | 72.4 /100 | #150 | Good 79.7% |