Immigrants from Somalia vs Immigrants from Honduras Average Family Size
COMPARE
Immigrants from Somalia
Immigrants from Honduras
Average Family Size
Average Family Size Comparison
Immigrants from Somalia
Immigrants from Honduras
3.20
AVERAGE FAMILY SIZE
10.3/ 100
METRIC RATING
217th/ 347
METRIC RANK
3.36
AVERAGE FAMILY SIZE
100.0/ 100
METRIC RATING
55th/ 347
METRIC RANK
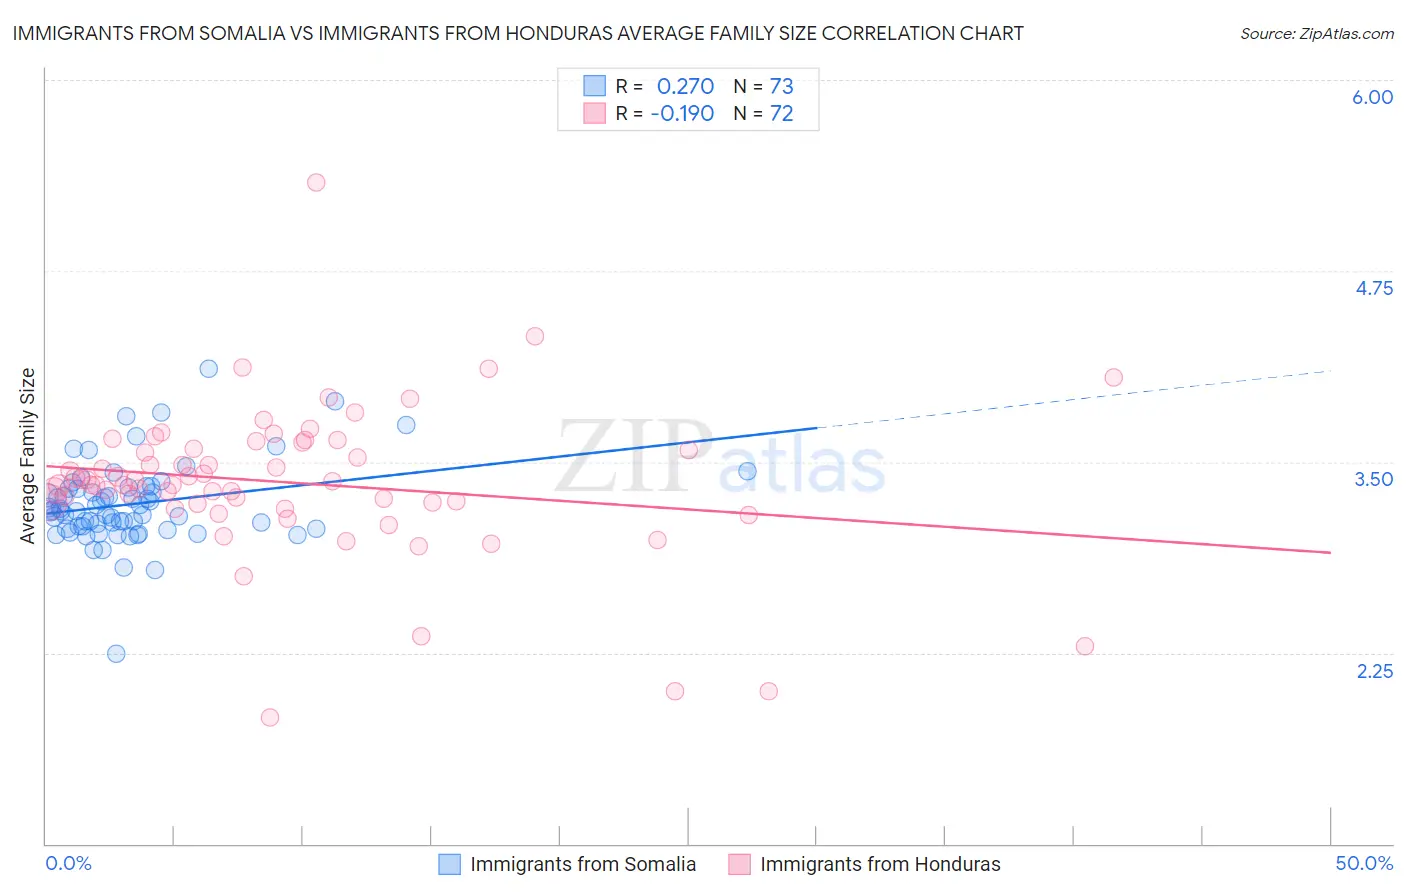
Immigrants from Somalia vs Immigrants from Honduras Average Family Size Correlation Chart
The statistical analysis conducted on geographies consisting of 92,093,605 people shows a weak positive correlation between the proportion of Immigrants from Somalia and average family size in the United States with a correlation coefficient (R) of 0.270 and weighted average of 3.20. Similarly, the statistical analysis conducted on geographies consisting of 322,466,970 people shows a poor negative correlation between the proportion of Immigrants from Honduras and average family size in the United States with a correlation coefficient (R) of -0.190 and weighted average of 3.36, a difference of 5.0%.
Average Family Size Correlation Summary
| Measurement | Immigrants from Somalia | Immigrants from Honduras |
| Minimum | 2.24 | 1.83 |
| Maximum | 4.11 | 5.33 |
| Range | 1.87 | 3.50 |
| Mean | 3.23 | 3.36 |
| Median | 3.18 | 3.36 |
| Interquartile 25% (IQ1) | 3.07 | 3.23 |
| Interquartile 75% (IQ3) | 3.33 | 3.61 |
| Interquartile Range (IQR) | 0.26 | 0.38 |
| Standard Deviation (Sample) | 0.27 | 0.51 |
| Standard Deviation (Population) | 0.27 | 0.50 |
Similar Demographics by Average Family Size
Demographics Similar to Immigrants from Somalia by Average Family Size
In terms of average family size, the demographic groups most similar to Immigrants from Somalia are Bermudan (3.20, a difference of 0.030%), French American Indian (3.20, a difference of 0.030%), Somali (3.20, a difference of 0.040%), Delaware (3.20, a difference of 0.040%), and Pennsylvania German (3.19, a difference of 0.050%).
| Demographics | Rating | Rank | Average Family Size |
| Zimbabweans | 12.6 /100 | #210 | Poor 3.20 |
| Immigrants | Iran | 12.1 /100 | #211 | Poor 3.20 |
| Creek | 12.1 /100 | #212 | Poor 3.20 |
| Mongolians | 11.5 /100 | #213 | Poor 3.20 |
| Somalis | 11.2 /100 | #214 | Poor 3.20 |
| Delaware | 11.1 /100 | #215 | Poor 3.20 |
| Bermudans | 11.0 /100 | #216 | Poor 3.20 |
| Immigrants | Somalia | 10.3 /100 | #217 | Poor 3.20 |
| French American Indians | 9.8 /100 | #218 | Tragic 3.20 |
| Pennsylvania Germans | 9.3 /100 | #219 | Tragic 3.19 |
| Lebanese | 9.1 /100 | #220 | Tragic 3.19 |
| Immigrants | Ukraine | 7.2 /100 | #221 | Tragic 3.19 |
| Immigrants | Kuwait | 7.2 /100 | #222 | Tragic 3.19 |
| Immigrants | Zimbabwe | 7.1 /100 | #223 | Tragic 3.19 |
| Syrians | 6.5 /100 | #224 | Tragic 3.19 |
Demographics Similar to Immigrants from Honduras by Average Family Size
In terms of average family size, the demographic groups most similar to Immigrants from Honduras are Immigrants from South Eastern Asia (3.36, a difference of 0.040%), Korean (3.36, a difference of 0.060%), Immigrants from Dominican Republic (3.35, a difference of 0.070%), Fijian (3.36, a difference of 0.090%), and Sri Lankan (3.35, a difference of 0.12%).
| Demographics | Rating | Rank | Average Family Size |
| Immigrants | Nicaragua | 100.0 /100 | #48 | Exceptional 3.37 |
| Bangladeshis | 100.0 /100 | #49 | Exceptional 3.37 |
| Immigrants | Bangladesh | 100.0 /100 | #50 | Exceptional 3.36 |
| Nicaraguans | 100.0 /100 | #51 | Exceptional 3.36 |
| Fijians | 100.0 /100 | #52 | Exceptional 3.36 |
| Koreans | 100.0 /100 | #53 | Exceptional 3.36 |
| Immigrants | South Eastern Asia | 100.0 /100 | #54 | Exceptional 3.36 |
| Immigrants | Honduras | 100.0 /100 | #55 | Exceptional 3.36 |
| Immigrants | Dominican Republic | 100.0 /100 | #56 | Exceptional 3.35 |
| Sri Lankans | 100.0 /100 | #57 | Exceptional 3.35 |
| Hondurans | 100.0 /100 | #58 | Exceptional 3.35 |
| Japanese | 100.0 /100 | #59 | Exceptional 3.35 |
| Immigrants | Armenia | 100.0 /100 | #60 | Exceptional 3.35 |
| Central American Indians | 100.0 /100 | #61 | Exceptional 3.35 |
| Immigrants | Grenada | 100.0 /100 | #62 | Exceptional 3.34 |