Immigrants from Canada vs Dominican Single Mother Households
COMPARE
Immigrants from Canada
Dominican
Single Mother Households
Single Mother Households Comparison
Immigrants from Canada
Dominicans
5.6%
SINGLE MOTHER HOUSEHOLDS
98.5/ 100
METRIC RATING
66th/ 347
METRIC RANK
9.2%
SINGLE MOTHER HOUSEHOLDS
0.0/ 100
METRIC RATING
343rd/ 347
METRIC RANK
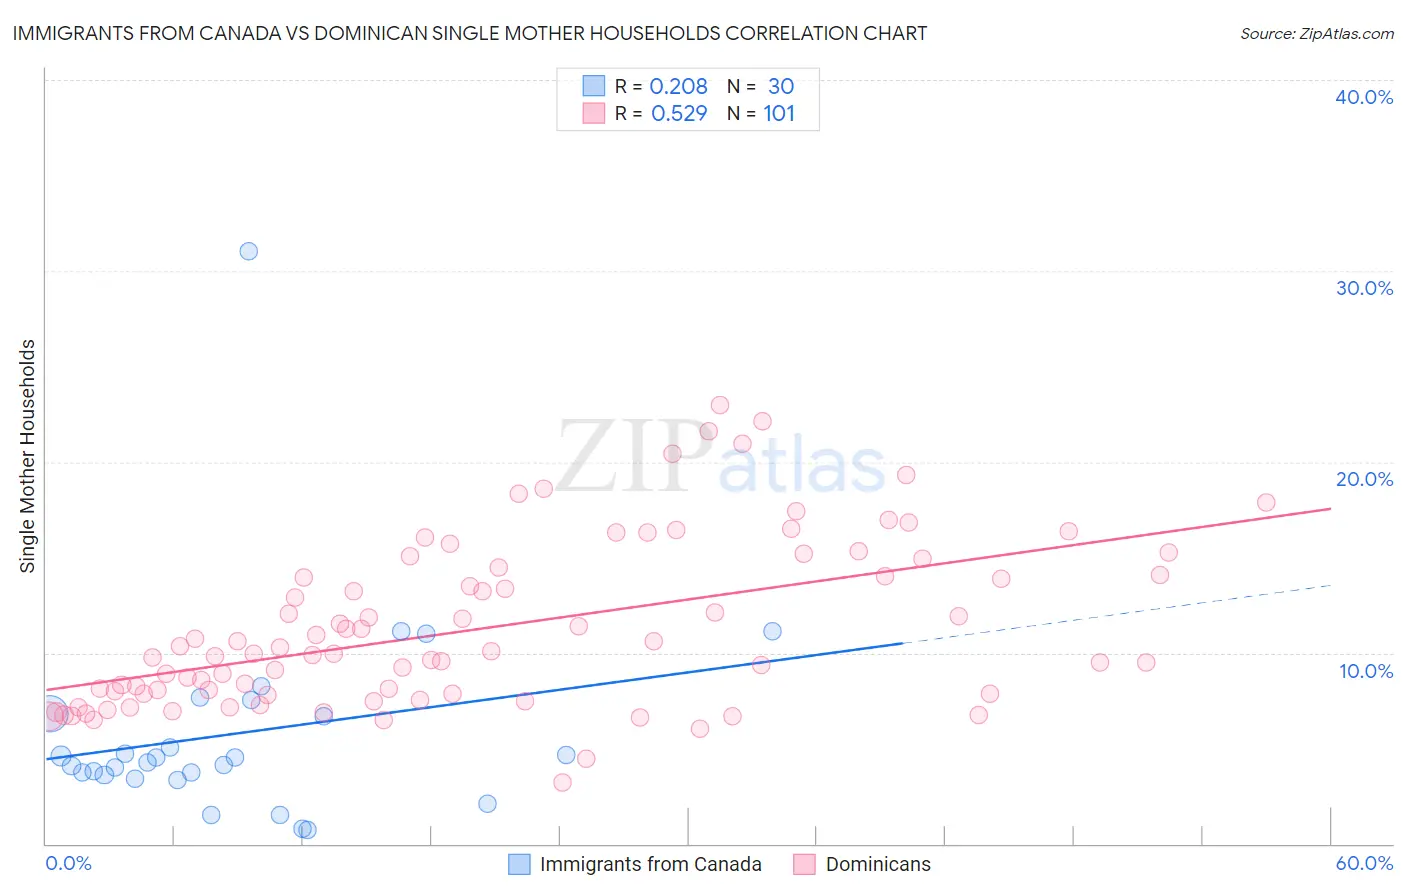
Immigrants from Canada vs Dominican Single Mother Households Correlation Chart
The statistical analysis conducted on geographies consisting of 457,332,787 people shows a weak positive correlation between the proportion of Immigrants from Canada and percentage of single mother households in the United States with a correlation coefficient (R) of 0.208 and weighted average of 5.6%. Similarly, the statistical analysis conducted on geographies consisting of 354,173,305 people shows a substantial positive correlation between the proportion of Dominicans and percentage of single mother households in the United States with a correlation coefficient (R) of 0.529 and weighted average of 9.2%, a difference of 64.4%.
Single Mother Households Correlation Summary
| Measurement | Immigrants from Canada | Dominican |
| Minimum | 0.70% | 3.2% |
| Maximum | 31.0% | 23.0% |
| Range | 30.3% | 19.8% |
| Mean | 5.8% | 11.3% |
| Median | 4.4% | 10.0% |
| Interquartile 25% (IQ1) | 3.6% | 7.9% |
| Interquartile 75% (IQ3) | 6.8% | 14.3% |
| Interquartile Range (IQR) | 3.2% | 6.4% |
| Standard Deviation (Sample) | 5.5% | 4.3% |
| Standard Deviation (Population) | 5.4% | 4.3% |
Similar Demographics by Single Mother Households
Demographics Similar to Immigrants from Canada by Single Mother Households
In terms of single mother households, the demographic groups most similar to Immigrants from Canada are Italian (5.6%, a difference of 0.020%), Immigrants from Bulgaria (5.6%, a difference of 0.080%), Greek (5.6%, a difference of 0.10%), Asian (5.6%, a difference of 0.11%), and Immigrants from France (5.6%, a difference of 0.15%).
| Demographics | Rating | Rank | Single Mother Households |
| Luxembourgers | 98.7 /100 | #59 | Exceptional 5.6% |
| Immigrants | Norway | 98.7 /100 | #60 | Exceptional 5.6% |
| Australians | 98.7 /100 | #61 | Exceptional 5.6% |
| Poles | 98.6 /100 | #62 | Exceptional 5.6% |
| Immigrants | North Macedonia | 98.6 /100 | #63 | Exceptional 5.6% |
| Immigrants | France | 98.6 /100 | #64 | Exceptional 5.6% |
| Greeks | 98.6 /100 | #65 | Exceptional 5.6% |
| Immigrants | Canada | 98.5 /100 | #66 | Exceptional 5.6% |
| Italians | 98.5 /100 | #67 | Exceptional 5.6% |
| Immigrants | Bulgaria | 98.5 /100 | #68 | Exceptional 5.6% |
| Asians | 98.5 /100 | #69 | Exceptional 5.6% |
| Immigrants | Eastern Europe | 98.4 /100 | #70 | Exceptional 5.6% |
| Immigrants | Kazakhstan | 98.4 /100 | #71 | Exceptional 5.6% |
| Immigrants | Netherlands | 98.4 /100 | #72 | Exceptional 5.6% |
| Immigrants | Asia | 98.4 /100 | #73 | Exceptional 5.6% |
Demographics Similar to Dominicans by Single Mother Households
In terms of single mother households, the demographic groups most similar to Dominicans are Menominee (9.2%, a difference of 0.21%), Tohono O'odham (9.1%, a difference of 0.53%), Lumbee (9.1%, a difference of 0.89%), Black/African American (9.0%, a difference of 2.1%), and Immigrants from Dominican Republic (9.5%, a difference of 3.5%).
| Demographics | Rating | Rank | Single Mother Households |
| Liberians | 0.0 /100 | #333 | Tragic 8.6% |
| Immigrants | Liberia | 0.0 /100 | #334 | Tragic 8.7% |
| Immigrants | Dominica | 0.0 /100 | #335 | Tragic 8.7% |
| Puerto Ricans | 0.0 /100 | #336 | Tragic 8.7% |
| Navajo | 0.0 /100 | #337 | Tragic 8.8% |
| Cape Verdeans | 0.0 /100 | #338 | Tragic 8.9% |
| Blacks/African Americans | 0.0 /100 | #339 | Tragic 9.0% |
| Lumbee | 0.0 /100 | #340 | Tragic 9.1% |
| Tohono O'odham | 0.0 /100 | #341 | Tragic 9.1% |
| Menominee | 0.0 /100 | #342 | Tragic 9.2% |
| Dominicans | 0.0 /100 | #343 | Tragic 9.2% |
| Immigrants | Dominican Republic | 0.0 /100 | #344 | Tragic 9.5% |
| Immigrants | Cabo Verde | 0.0 /100 | #345 | Tragic 9.6% |
| Yuman | 0.0 /100 | #346 | Tragic 9.6% |
| Yup'ik | 0.0 /100 | #347 | Tragic 10.0% |