European vs Dominican Single Mother Households
COMPARE
European
Dominican
Single Mother Households
Single Mother Households Comparison
Europeans
Dominicans
5.7%
SINGLE MOTHER HOUSEHOLDS
97.0/ 100
METRIC RATING
91st/ 347
METRIC RANK
9.2%
SINGLE MOTHER HOUSEHOLDS
0.0/ 100
METRIC RATING
343rd/ 347
METRIC RANK
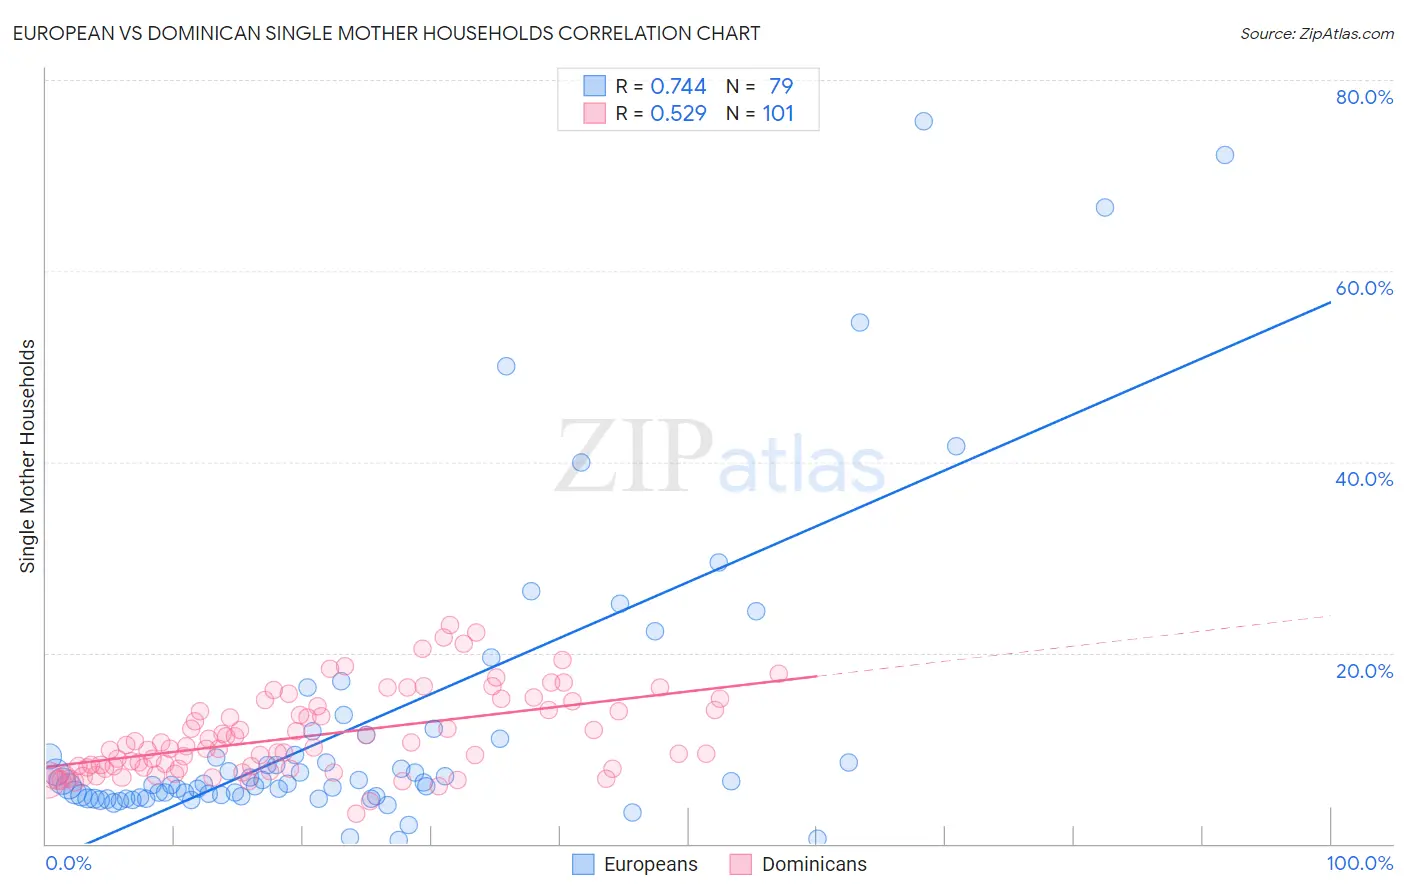
European vs Dominican Single Mother Households Correlation Chart
The statistical analysis conducted on geographies consisting of 557,141,614 people shows a strong positive correlation between the proportion of Europeans and percentage of single mother households in the United States with a correlation coefficient (R) of 0.744 and weighted average of 5.7%. Similarly, the statistical analysis conducted on geographies consisting of 354,173,305 people shows a substantial positive correlation between the proportion of Dominicans and percentage of single mother households in the United States with a correlation coefficient (R) of 0.529 and weighted average of 9.2%, a difference of 60.7%.
Single Mother Households Correlation Summary
| Measurement | European | Dominican |
| Minimum | 0.36% | 3.2% |
| Maximum | 75.7% | 23.0% |
| Range | 75.3% | 19.8% |
| Mean | 12.4% | 11.3% |
| Median | 6.3% | 10.0% |
| Interquartile 25% (IQ1) | 5.0% | 7.9% |
| Interquartile 75% (IQ3) | 11.1% | 14.3% |
| Interquartile Range (IQR) | 6.1% | 6.4% |
| Standard Deviation (Sample) | 15.7% | 4.3% |
| Standard Deviation (Population) | 15.6% | 4.3% |
Similar Demographics by Single Mother Households
Demographics Similar to Europeans by Single Mother Households
In terms of single mother households, the demographic groups most similar to Europeans are Immigrants from Indonesia (5.7%, a difference of 0.22%), Immigrants from Western Asia (5.7%, a difference of 0.23%), Serbian (5.7%, a difference of 0.24%), Ukrainian (5.7%, a difference of 0.28%), and Basque (5.7%, a difference of 0.29%).
| Demographics | Rating | Rank | Single Mother Households |
| Carpatho Rusyns | 97.7 /100 | #84 | Exceptional 5.7% |
| Hungarians | 97.6 /100 | #85 | Exceptional 5.7% |
| Finns | 97.6 /100 | #86 | Exceptional 5.7% |
| Immigrants | Turkey | 97.5 /100 | #87 | Exceptional 5.7% |
| Israelis | 97.4 /100 | #88 | Exceptional 5.7% |
| Ukrainians | 97.2 /100 | #89 | Exceptional 5.7% |
| Immigrants | Indonesia | 97.2 /100 | #90 | Exceptional 5.7% |
| Europeans | 97.0 /100 | #91 | Exceptional 5.7% |
| Immigrants | Western Asia | 96.7 /100 | #92 | Exceptional 5.7% |
| Serbians | 96.7 /100 | #93 | Exceptional 5.7% |
| Basques | 96.7 /100 | #94 | Exceptional 5.7% |
| Slovaks | 96.6 /100 | #95 | Exceptional 5.7% |
| Austrians | 96.4 /100 | #96 | Exceptional 5.7% |
| Tlingit-Haida | 96.4 /100 | #97 | Exceptional 5.7% |
| Immigrants | South Africa | 96.3 /100 | #98 | Exceptional 5.7% |
Demographics Similar to Dominicans by Single Mother Households
In terms of single mother households, the demographic groups most similar to Dominicans are Menominee (9.2%, a difference of 0.21%), Tohono O'odham (9.1%, a difference of 0.53%), Lumbee (9.1%, a difference of 0.89%), Black/African American (9.0%, a difference of 2.1%), and Immigrants from Dominican Republic (9.5%, a difference of 3.5%).
| Demographics | Rating | Rank | Single Mother Households |
| Liberians | 0.0 /100 | #333 | Tragic 8.6% |
| Immigrants | Liberia | 0.0 /100 | #334 | Tragic 8.7% |
| Immigrants | Dominica | 0.0 /100 | #335 | Tragic 8.7% |
| Puerto Ricans | 0.0 /100 | #336 | Tragic 8.7% |
| Navajo | 0.0 /100 | #337 | Tragic 8.8% |
| Cape Verdeans | 0.0 /100 | #338 | Tragic 8.9% |
| Blacks/African Americans | 0.0 /100 | #339 | Tragic 9.0% |
| Lumbee | 0.0 /100 | #340 | Tragic 9.1% |
| Tohono O'odham | 0.0 /100 | #341 | Tragic 9.1% |
| Menominee | 0.0 /100 | #342 | Tragic 9.2% |
| Dominicans | 0.0 /100 | #343 | Tragic 9.2% |
| Immigrants | Dominican Republic | 0.0 /100 | #344 | Tragic 9.5% |
| Immigrants | Cabo Verde | 0.0 /100 | #345 | Tragic 9.6% |
| Yuman | 0.0 /100 | #346 | Tragic 9.6% |
| Yup'ik | 0.0 /100 | #347 | Tragic 10.0% |