Immigrants from Singapore vs Thai Family Households with Children
COMPARE
Immigrants from Singapore
Thai
Family Households with Children
Family Households with Children Comparison
Immigrants from Singapore
Thais
27.8%
FAMILY HOUSEHOLDS WITH CHILDREN
90.8/ 100
METRIC RATING
124th/ 347
METRIC RANK
30.6%
FAMILY HOUSEHOLDS WITH CHILDREN
100.0/ 100
METRIC RATING
9th/ 347
METRIC RANK
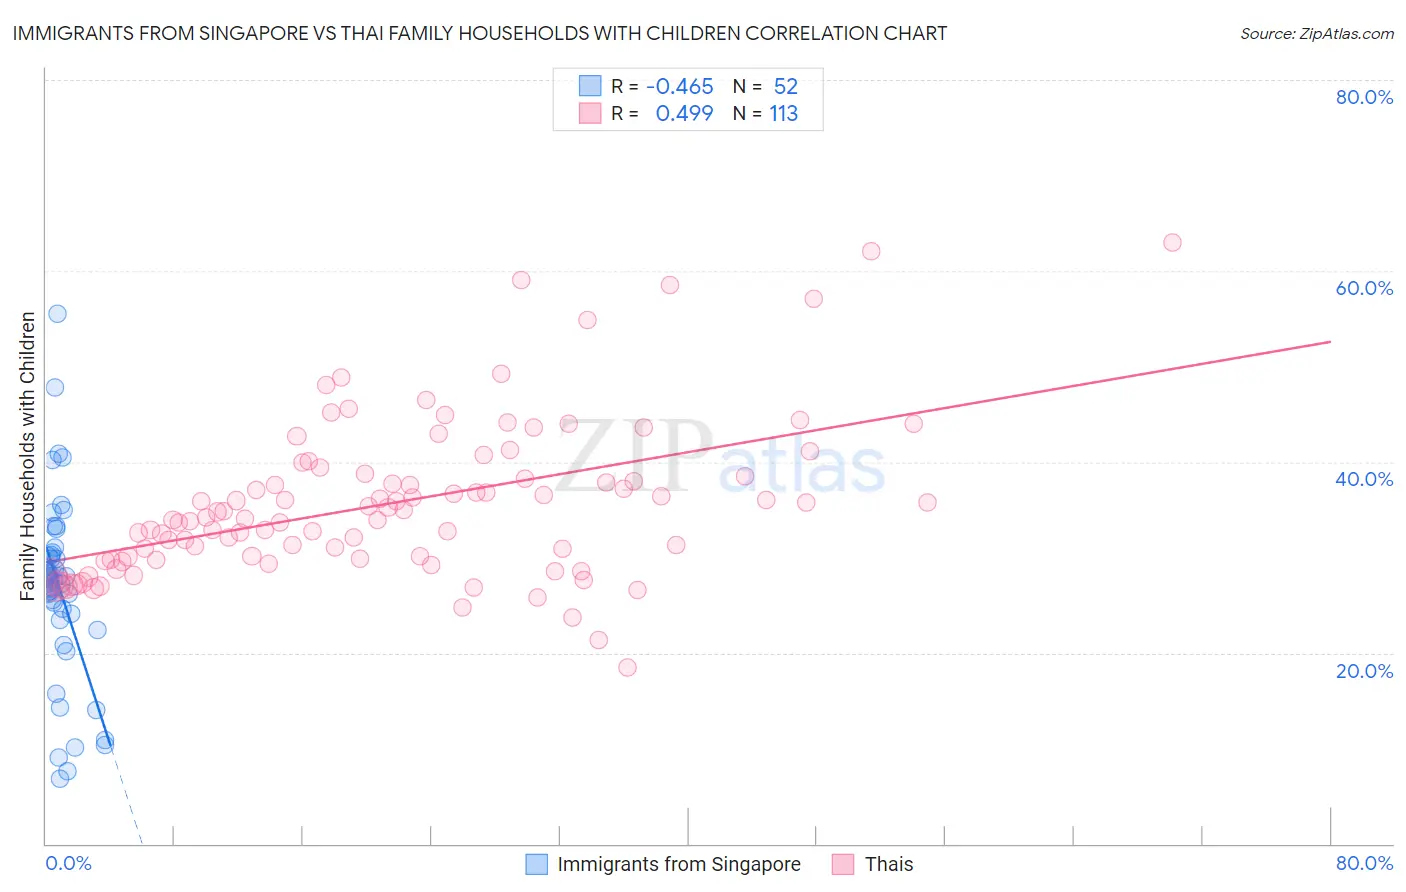
Immigrants from Singapore vs Thai Family Households with Children Correlation Chart
The statistical analysis conducted on geographies consisting of 137,406,161 people shows a moderate negative correlation between the proportion of Immigrants from Singapore and percentage of family households with children in the United States with a correlation coefficient (R) of -0.465 and weighted average of 27.8%. Similarly, the statistical analysis conducted on geographies consisting of 475,181,925 people shows a moderate positive correlation between the proportion of Thais and percentage of family households with children in the United States with a correlation coefficient (R) of 0.499 and weighted average of 30.6%, a difference of 10.2%.
Family Households with Children Correlation Summary
| Measurement | Immigrants from Singapore | Thai |
| Minimum | 6.8% | 18.5% |
| Maximum | 55.5% | 63.0% |
| Range | 48.7% | 44.5% |
| Mean | 26.7% | 35.6% |
| Median | 27.6% | 34.1% |
| Interquartile 25% (IQ1) | 23.8% | 29.8% |
| Interquartile 75% (IQ3) | 30.4% | 38.6% |
| Interquartile Range (IQR) | 6.6% | 8.8% |
| Standard Deviation (Sample) | 9.6% | 8.2% |
| Standard Deviation (Population) | 9.5% | 8.2% |
Similar Demographics by Family Households with Children
Demographics Similar to Immigrants from Singapore by Family Households with Children
In terms of family households with children, the demographic groups most similar to Immigrants from Singapore are Ecuadorian (27.8%, a difference of 0.0%), Immigrants from Ethiopia (27.8%, a difference of 0.020%), Belizean (27.8%, a difference of 0.050%), Immigrants from Northern Africa (27.8%, a difference of 0.070%), and Syrian (27.8%, a difference of 0.070%).
| Demographics | Rating | Rank | Family Households with Children |
| Immigrants | Malaysia | 95.9 /100 | #117 | Exceptional 27.9% |
| Central American Indians | 95.9 /100 | #118 | Exceptional 27.9% |
| Zimbabweans | 95.6 /100 | #119 | Exceptional 27.9% |
| Europeans | 95.4 /100 | #120 | Exceptional 27.9% |
| Immigrants | Western Asia | 93.6 /100 | #121 | Exceptional 27.9% |
| Immigrants | Zimbabwe | 92.8 /100 | #122 | Exceptional 27.8% |
| Immigrants | Northern Africa | 91.8 /100 | #123 | Exceptional 27.8% |
| Immigrants | Singapore | 90.8 /100 | #124 | Exceptional 27.8% |
| Ecuadorians | 90.8 /100 | #125 | Exceptional 27.8% |
| Immigrants | Ethiopia | 90.5 /100 | #126 | Exceptional 27.8% |
| Belizeans | 90.0 /100 | #127 | Exceptional 27.8% |
| Syrians | 89.7 /100 | #128 | Excellent 27.8% |
| Immigrants | Eritrea | 89.4 /100 | #129 | Excellent 27.8% |
| Cajuns | 87.6 /100 | #130 | Excellent 27.7% |
| Lebanese | 87.4 /100 | #131 | Excellent 27.7% |
Demographics Similar to Thais by Family Households with Children
In terms of family households with children, the demographic groups most similar to Thais are Immigrants from Fiji (30.5%, a difference of 0.32%), Nepalese (30.5%, a difference of 0.40%), Yakama (30.8%, a difference of 0.48%), Immigrants from Central America (31.0%, a difference of 1.1%), and Immigrants from Pakistan (30.2%, a difference of 1.3%).
| Demographics | Rating | Rank | Family Households with Children |
| Inupiat | 100 /100 | #2 | Exceptional 32.8% |
| Immigrants | Mexico | 100.0 /100 | #3 | Exceptional 31.6% |
| Mexicans | 100.0 /100 | #4 | Exceptional 31.4% |
| Tongans | 100.0 /100 | #5 | Exceptional 31.2% |
| Immigrants | India | 100.0 /100 | #6 | Exceptional 31.0% |
| Immigrants | Central America | 100.0 /100 | #7 | Exceptional 31.0% |
| Yakama | 100.0 /100 | #8 | Exceptional 30.8% |
| Thais | 100.0 /100 | #9 | Exceptional 30.6% |
| Immigrants | Fiji | 100.0 /100 | #10 | Exceptional 30.5% |
| Nepalese | 100.0 /100 | #11 | Exceptional 30.5% |
| Immigrants | Pakistan | 100.0 /100 | #12 | Exceptional 30.2% |
| Afghans | 100.0 /100 | #13 | Exceptional 30.2% |
| Bangladeshis | 100.0 /100 | #14 | Exceptional 30.1% |
| Immigrants | South Central Asia | 100.0 /100 | #15 | Exceptional 30.0% |
| Immigrants | Afghanistan | 100.0 /100 | #16 | Exceptional 30.0% |