Immigrants from Singapore vs German Russian Married-couple Households
COMPARE
Immigrants from Singapore
German Russian
Married-couple Households
Married-couple Households Comparison
Immigrants from Singapore
German Russians
48.3%
MARRIED-COUPLE HOUSEHOLDS
98.6/ 100
METRIC RATING
73rd/ 347
METRIC RANK
44.0%
MARRIED-COUPLE HOUSEHOLDS
0.4/ 100
METRIC RATING
251st/ 347
METRIC RANK
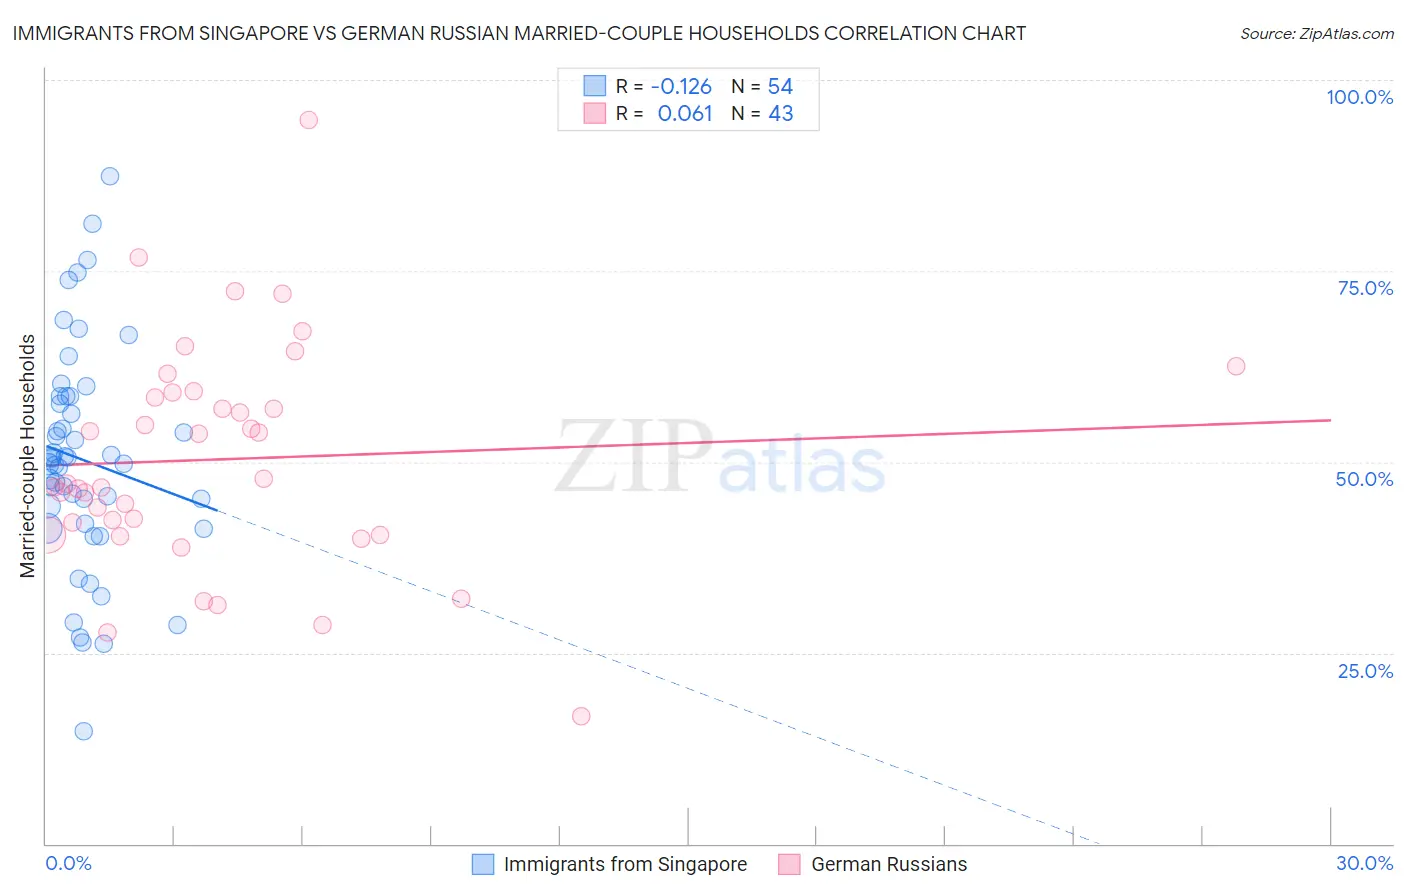
Immigrants from Singapore vs German Russian Married-couple Households Correlation Chart
The statistical analysis conducted on geographies consisting of 137,440,387 people shows a poor negative correlation between the proportion of Immigrants from Singapore and percentage of married-couple family households in the United States with a correlation coefficient (R) of -0.126 and weighted average of 48.3%. Similarly, the statistical analysis conducted on geographies consisting of 96,451,375 people shows a slight positive correlation between the proportion of German Russians and percentage of married-couple family households in the United States with a correlation coefficient (R) of 0.061 and weighted average of 44.0%, a difference of 9.7%.
Married-couple Households Correlation Summary
| Measurement | Immigrants from Singapore | German Russian |
| Minimum | 14.8% | 16.7% |
| Maximum | 87.3% | 94.7% |
| Range | 72.5% | 78.1% |
| Mean | 50.2% | 50.3% |
| Median | 50.1% | 47.1% |
| Interquartile 25% (IQ1) | 41.8% | 40.4% |
| Interquartile 75% (IQ3) | 58.6% | 59.0% |
| Interquartile Range (IQR) | 16.7% | 18.6% |
| Standard Deviation (Sample) | 14.5% | 14.7% |
| Standard Deviation (Population) | 14.3% | 14.5% |
Similar Demographics by Married-couple Households
Demographics Similar to Immigrants from Singapore by Married-couple Households
In terms of married-couple households, the demographic groups most similar to Immigrants from Singapore are Immigrants from Romania (48.3%, a difference of 0.010%), Scotch-Irish (48.3%, a difference of 0.020%), Immigrants from England (48.2%, a difference of 0.10%), Immigrants from Fiji (48.2%, a difference of 0.10%), and Laotian (48.4%, a difference of 0.19%).
| Demographics | Rating | Rank | Married-couple Households |
| Jordanians | 98.9 /100 | #66 | Exceptional 48.4% |
| Romanians | 98.9 /100 | #67 | Exceptional 48.4% |
| Immigrants | South Eastern Asia | 98.9 /100 | #68 | Exceptional 48.4% |
| Immigrants | China | 98.9 /100 | #69 | Exceptional 48.4% |
| Immigrants | North America | 98.9 /100 | #70 | Exceptional 48.4% |
| Laotians | 98.8 /100 | #71 | Exceptional 48.4% |
| Scotch-Irish | 98.6 /100 | #72 | Exceptional 48.3% |
| Immigrants | Singapore | 98.6 /100 | #73 | Exceptional 48.3% |
| Immigrants | Romania | 98.6 /100 | #74 | Exceptional 48.3% |
| Immigrants | England | 98.4 /100 | #75 | Exceptional 48.2% |
| Immigrants | Fiji | 98.4 /100 | #76 | Exceptional 48.2% |
| Canadians | 98.2 /100 | #77 | Exceptional 48.2% |
| Egyptians | 98.2 /100 | #78 | Exceptional 48.2% |
| Immigrants | Netherlands | 98.2 /100 | #79 | Exceptional 48.2% |
| Russians | 98.1 /100 | #80 | Exceptional 48.2% |
Demographics Similar to German Russians by Married-couple Households
In terms of married-couple households, the demographic groups most similar to German Russians are Seminole (44.0%, a difference of 0.070%), French American Indian (44.1%, a difference of 0.080%), Immigrants from Kenya (44.1%, a difference of 0.090%), Yup'ik (44.1%, a difference of 0.14%), and Central American (43.9%, a difference of 0.19%).
| Demographics | Rating | Rank | Married-couple Households |
| Immigrants | Armenia | 0.7 /100 | #244 | Tragic 44.3% |
| Immigrants | El Salvador | 0.7 /100 | #245 | Tragic 44.3% |
| Immigrants | Cuba | 0.6 /100 | #246 | Tragic 44.2% |
| Immigrants | Morocco | 0.6 /100 | #247 | Tragic 44.2% |
| Yup'ik | 0.4 /100 | #248 | Tragic 44.1% |
| Immigrants | Kenya | 0.4 /100 | #249 | Tragic 44.1% |
| French American Indians | 0.4 /100 | #250 | Tragic 44.1% |
| German Russians | 0.4 /100 | #251 | Tragic 44.0% |
| Seminole | 0.4 /100 | #252 | Tragic 44.0% |
| Central Americans | 0.3 /100 | #253 | Tragic 43.9% |
| Apache | 0.3 /100 | #254 | Tragic 43.9% |
| Shoshone | 0.3 /100 | #255 | Tragic 43.9% |
| Ugandans | 0.3 /100 | #256 | Tragic 43.8% |
| Blackfeet | 0.2 /100 | #257 | Tragic 43.8% |
| Central American Indians | 0.2 /100 | #258 | Tragic 43.8% |