Immigrants from Romania vs Filipino Divorced or Separated
COMPARE
Immigrants from Romania
Filipino
Divorced or Separated
Divorced or Separated Comparison
Immigrants from Romania
Filipinos
11.5%
DIVORCED OR SEPARATED
99.3/ 100
METRIC RATING
82nd/ 347
METRIC RANK
9.9%
DIVORCED OR SEPARATED
100.0/ 100
METRIC RATING
2nd/ 347
METRIC RANK
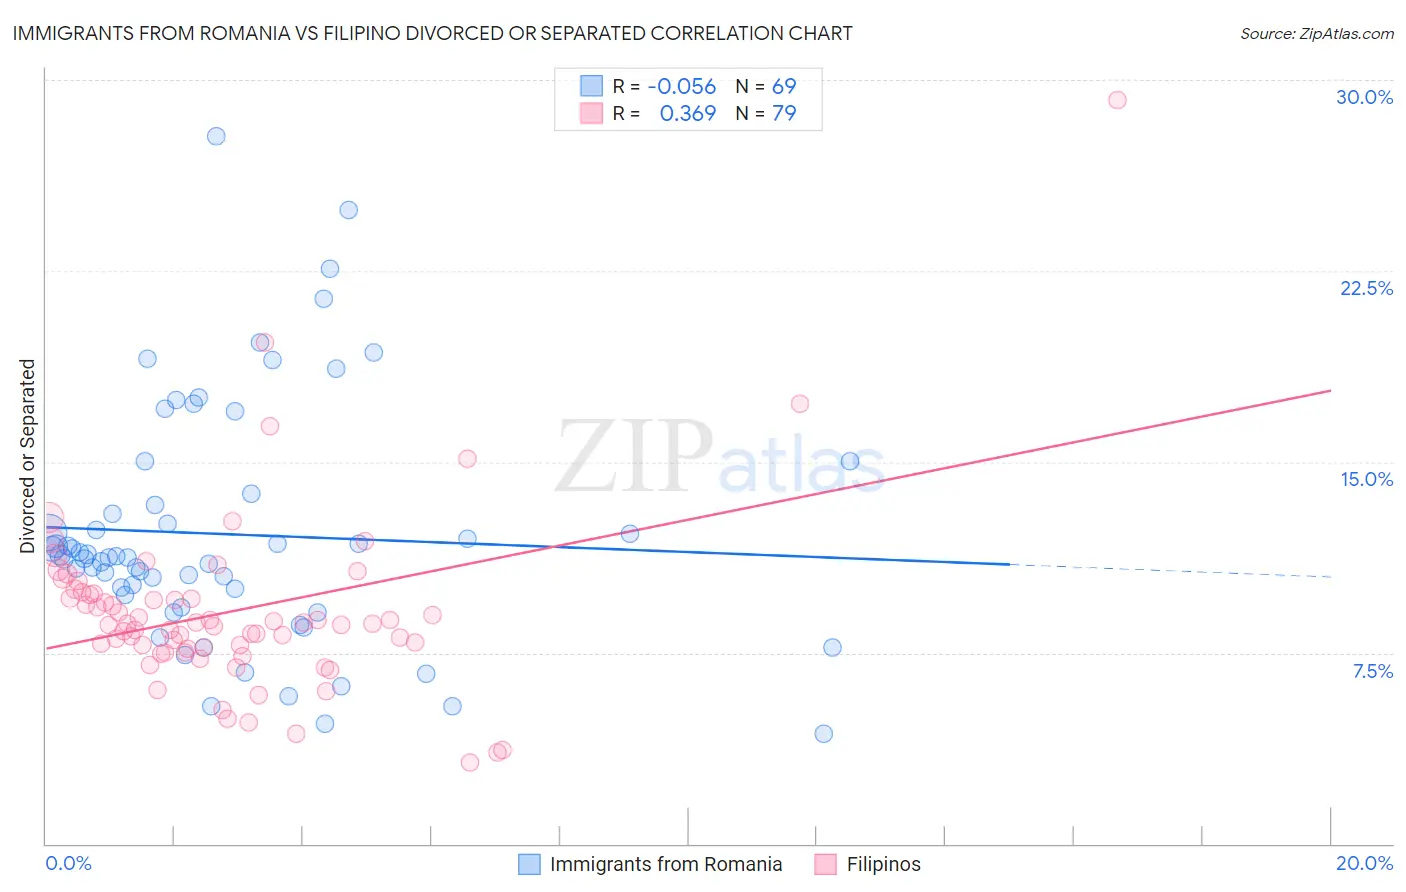
Immigrants from Romania vs Filipino Divorced or Separated Correlation Chart
The statistical analysis conducted on geographies consisting of 256,993,939 people shows a slight negative correlation between the proportion of Immigrants from Romania and percentage of population currently divorced or separated in the United States with a correlation coefficient (R) of -0.056 and weighted average of 11.5%. Similarly, the statistical analysis conducted on geographies consisting of 254,211,559 people shows a mild positive correlation between the proportion of Filipinos and percentage of population currently divorced or separated in the United States with a correlation coefficient (R) of 0.369 and weighted average of 9.9%, a difference of 16.3%.
Divorced or Separated Correlation Summary
| Measurement | Immigrants from Romania | Filipino |
| Minimum | 4.3% | 3.2% |
| Maximum | 27.8% | 29.2% |
| Range | 23.5% | 26.0% |
| Mean | 12.2% | 9.1% |
| Median | 11.3% | 8.7% |
| Interquartile 25% (IQ1) | 9.5% | 7.7% |
| Interquartile 75% (IQ3) | 13.5% | 9.8% |
| Interquartile Range (IQR) | 4.0% | 2.2% |
| Standard Deviation (Sample) | 4.7% | 3.6% |
| Standard Deviation (Population) | 4.7% | 3.5% |
Similar Demographics by Divorced or Separated
Demographics Similar to Immigrants from Romania by Divorced or Separated
In terms of divorced or separated, the demographic groups most similar to Immigrants from Romania are Immigrants from Bulgaria (11.5%, a difference of 0.030%), Bulgarian (11.5%, a difference of 0.050%), Russian (11.5%, a difference of 0.080%), Immigrants from Switzerland (11.5%, a difference of 0.090%), and Guyanese (11.5%, a difference of 0.11%).
| Demographics | Rating | Rank | Divorced or Separated |
| Immigrants | Northern Africa | 99.6 /100 | #75 | Exceptional 11.5% |
| Albanians | 99.6 /100 | #76 | Exceptional 11.5% |
| Immigrants | Italy | 99.5 /100 | #77 | Exceptional 11.5% |
| Afghans | 99.4 /100 | #78 | Exceptional 11.5% |
| Guyanese | 99.4 /100 | #79 | Exceptional 11.5% |
| Immigrants | Switzerland | 99.4 /100 | #80 | Exceptional 11.5% |
| Russians | 99.4 /100 | #81 | Exceptional 11.5% |
| Immigrants | Romania | 99.3 /100 | #82 | Exceptional 11.5% |
| Immigrants | Bulgaria | 99.3 /100 | #83 | Exceptional 11.5% |
| Bulgarians | 99.3 /100 | #84 | Exceptional 11.5% |
| Immigrants | Albania | 99.3 /100 | #85 | Exceptional 11.5% |
| Immigrants | Latvia | 99.2 /100 | #86 | Exceptional 11.6% |
| Immigrants | Nepal | 99.2 /100 | #87 | Exceptional 11.6% |
| Immigrants | Europe | 99.2 /100 | #88 | Exceptional 11.6% |
| Immigrants | Southern Europe | 99.1 /100 | #89 | Exceptional 11.6% |
Demographics Similar to Filipinos by Divorced or Separated
In terms of divorced or separated, the demographic groups most similar to Filipinos are Immigrants from Hong Kong (10.0%, a difference of 0.56%), Immigrants from Taiwan (9.8%, a difference of 1.1%), Immigrants from China (10.0%, a difference of 1.3%), Immigrants from India (10.1%, a difference of 1.5%), and Indian (Asian) (10.2%, a difference of 2.9%).
| Demographics | Rating | Rank | Divorced or Separated |
| Immigrants | Taiwan | 100.0 /100 | #1 | Exceptional 9.8% |
| Filipinos | 100.0 /100 | #2 | Exceptional 9.9% |
| Immigrants | Hong Kong | 100.0 /100 | #3 | Exceptional 10.0% |
| Immigrants | China | 100.0 /100 | #4 | Exceptional 10.0% |
| Immigrants | India | 100.0 /100 | #5 | Exceptional 10.1% |
| Indians (Asian) | 100.0 /100 | #6 | Exceptional 10.2% |
| Thais | 100.0 /100 | #7 | Exceptional 10.2% |
| Immigrants | Eastern Asia | 100.0 /100 | #8 | Exceptional 10.2% |
| Yup'ik | 100.0 /100 | #9 | Exceptional 10.3% |
| Immigrants | Singapore | 100.0 /100 | #10 | Exceptional 10.3% |
| Immigrants | South Central Asia | 100.0 /100 | #11 | Exceptional 10.4% |
| Okinawans | 100.0 /100 | #12 | Exceptional 10.5% |
| Cypriots | 100.0 /100 | #13 | Exceptional 10.5% |
| Assyrians/Chaldeans/Syriacs | 100.0 /100 | #14 | Exceptional 10.6% |
| Immigrants | Armenia | 100.0 /100 | #15 | Exceptional 10.6% |