Dominican vs Central American Single Mother Households
COMPARE
Dominican
Central American
Single Mother Households
Single Mother Households Comparison
Dominicans
Central Americans
9.2%
SINGLE MOTHER HOUSEHOLDS
0.0/ 100
METRIC RATING
343rd/ 347
METRIC RANK
7.6%
SINGLE MOTHER HOUSEHOLDS
0.1/ 100
METRIC RATING
278th/ 347
METRIC RANK
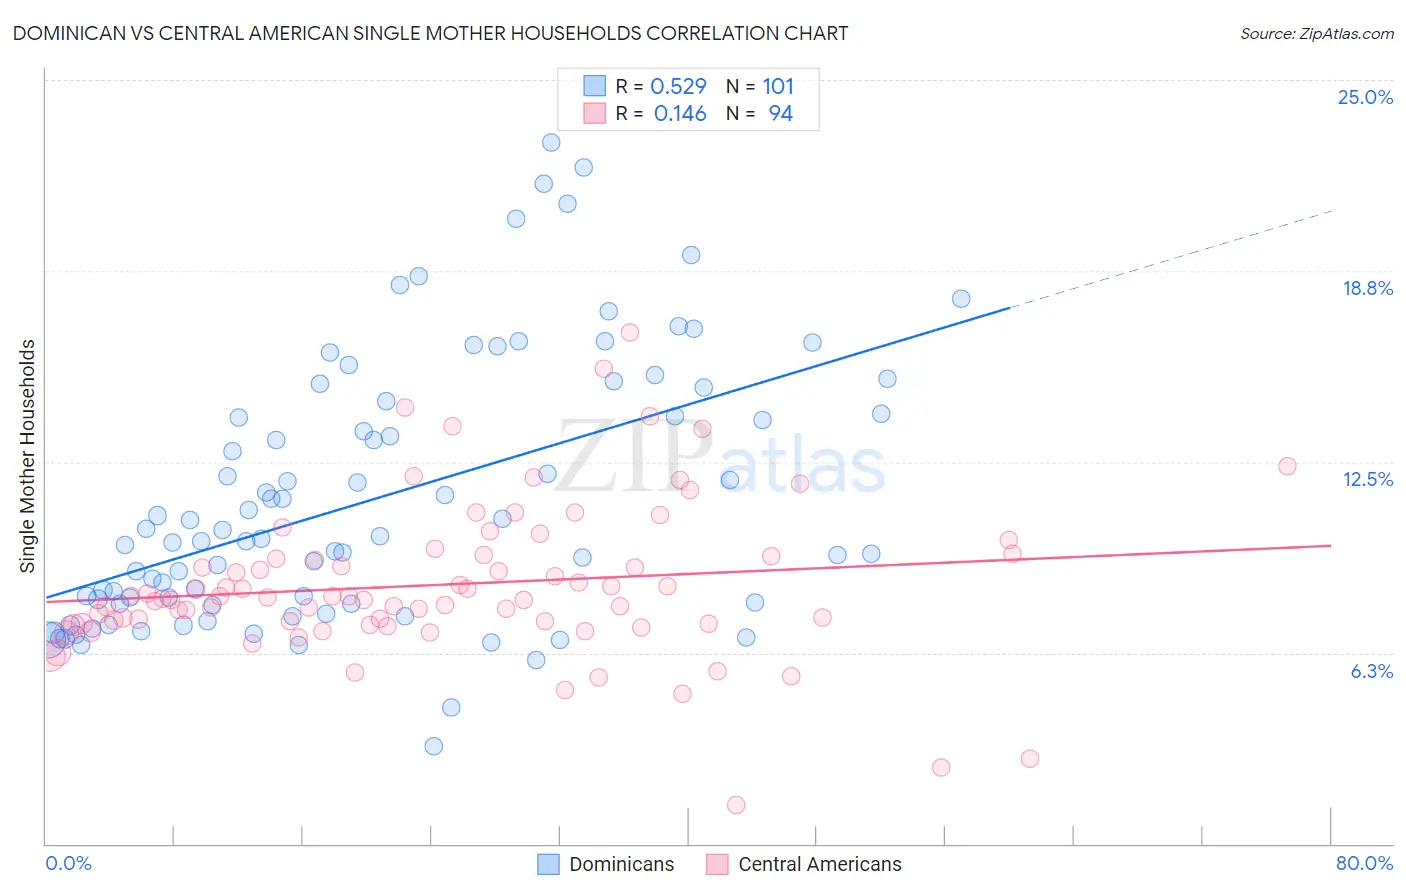
Dominican vs Central American Single Mother Households Correlation Chart
The statistical analysis conducted on geographies consisting of 354,173,305 people shows a substantial positive correlation between the proportion of Dominicans and percentage of single mother households in the United States with a correlation coefficient (R) of 0.529 and weighted average of 9.2%. Similarly, the statistical analysis conducted on geographies consisting of 502,537,291 people shows a poor positive correlation between the proportion of Central Americans and percentage of single mother households in the United States with a correlation coefficient (R) of 0.146 and weighted average of 7.6%, a difference of 20.7%.
Single Mother Households Correlation Summary
| Measurement | Dominican | Central American |
| Minimum | 3.2% | 1.3% |
| Maximum | 23.0% | 16.7% |
| Range | 19.8% | 15.5% |
| Mean | 11.3% | 8.5% |
| Median | 10.0% | 8.0% |
| Interquartile 25% (IQ1) | 7.9% | 7.2% |
| Interquartile 75% (IQ3) | 14.3% | 9.4% |
| Interquartile Range (IQR) | 6.4% | 2.2% |
| Standard Deviation (Sample) | 4.3% | 2.5% |
| Standard Deviation (Population) | 4.3% | 2.5% |
Similar Demographics by Single Mother Households
Demographics Similar to Dominicans by Single Mother Households
In terms of single mother households, the demographic groups most similar to Dominicans are Menominee (9.2%, a difference of 0.21%), Tohono O'odham (9.1%, a difference of 0.53%), Lumbee (9.1%, a difference of 0.89%), Black/African American (9.0%, a difference of 2.1%), and Immigrants from Dominican Republic (9.5%, a difference of 3.5%).
| Demographics | Rating | Rank | Single Mother Households |
| Liberians | 0.0 /100 | #333 | Tragic 8.6% |
| Immigrants | Liberia | 0.0 /100 | #334 | Tragic 8.7% |
| Immigrants | Dominica | 0.0 /100 | #335 | Tragic 8.7% |
| Puerto Ricans | 0.0 /100 | #336 | Tragic 8.7% |
| Navajo | 0.0 /100 | #337 | Tragic 8.8% |
| Cape Verdeans | 0.0 /100 | #338 | Tragic 8.9% |
| Blacks/African Americans | 0.0 /100 | #339 | Tragic 9.0% |
| Lumbee | 0.0 /100 | #340 | Tragic 9.1% |
| Tohono O'odham | 0.0 /100 | #341 | Tragic 9.1% |
| Menominee | 0.0 /100 | #342 | Tragic 9.2% |
| Dominicans | 0.0 /100 | #343 | Tragic 9.2% |
| Immigrants | Dominican Republic | 0.0 /100 | #344 | Tragic 9.5% |
| Immigrants | Cabo Verde | 0.0 /100 | #345 | Tragic 9.6% |
| Yuman | 0.0 /100 | #346 | Tragic 9.6% |
| Yup'ik | 0.0 /100 | #347 | Tragic 10.0% |
Demographics Similar to Central Americans by Single Mother Households
In terms of single mother households, the demographic groups most similar to Central Americans are Immigrants from Trinidad and Tobago (7.6%, a difference of 0.0%), Guyanese (7.6%, a difference of 0.050%), Immigrants from El Salvador (7.6%, a difference of 0.22%), Central American Indian (7.6%, a difference of 0.49%), and Immigrants from Guyana (7.6%, a difference of 0.59%).
| Demographics | Rating | Rank | Single Mother Households |
| Salvadorans | 0.1 /100 | #271 | Tragic 7.5% |
| Immigrants | Azores | 0.1 /100 | #272 | Tragic 7.5% |
| Belizeans | 0.1 /100 | #273 | Tragic 7.6% |
| Immigrants | Guyana | 0.1 /100 | #274 | Tragic 7.6% |
| Central American Indians | 0.1 /100 | #275 | Tragic 7.6% |
| Guyanese | 0.1 /100 | #276 | Tragic 7.6% |
| Immigrants | Trinidad and Tobago | 0.1 /100 | #277 | Tragic 7.6% |
| Central Americans | 0.1 /100 | #278 | Tragic 7.6% |
| Immigrants | El Salvador | 0.0 /100 | #279 | Tragic 7.6% |
| Immigrants | Sierra Leone | 0.0 /100 | #280 | Tragic 7.7% |
| Immigrants | Laos | 0.0 /100 | #281 | Tragic 7.7% |
| Guatemalans | 0.0 /100 | #282 | Tragic 7.7% |
| Nigerians | 0.0 /100 | #283 | Tragic 7.7% |
| Immigrants | Belize | 0.0 /100 | #284 | Tragic 7.7% |
| Trinidadians and Tobagonians | 0.0 /100 | #285 | Tragic 7.7% |